Open Access
Fig. 10
Download original image
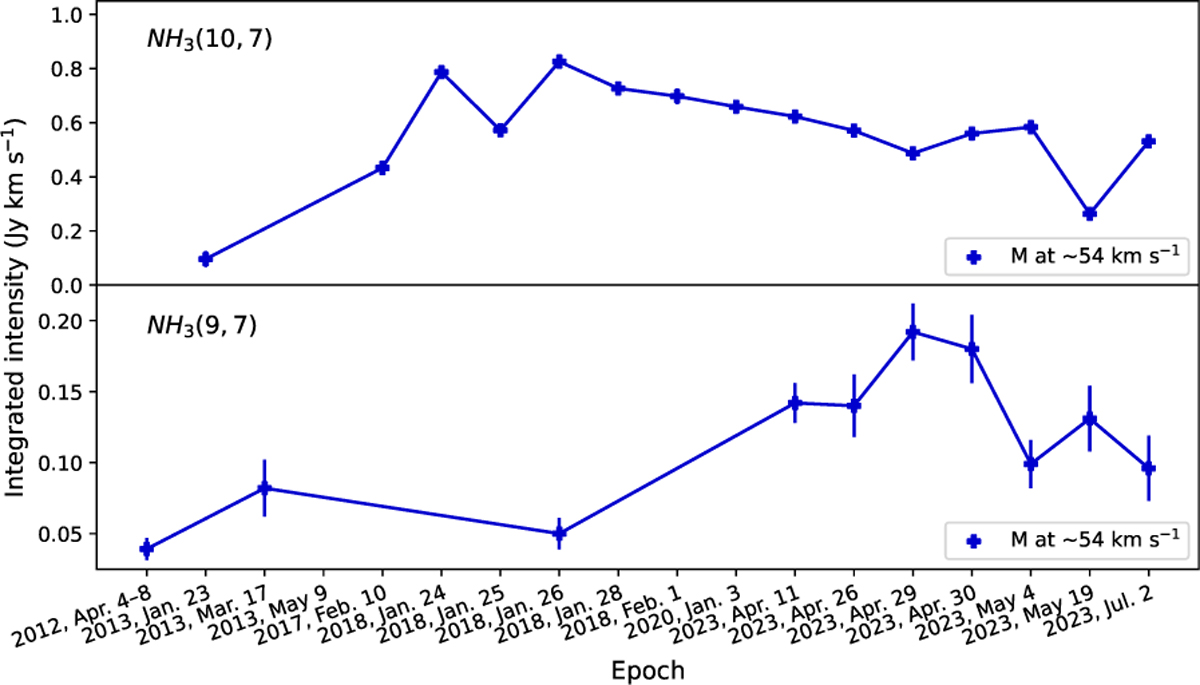
Comparison of integrated intensities of the (9,7) and (10,7) maser features. For the (9,7) line, the average for the epochs between January 24 and February 1, 2018, was set to January 26. For more details, see Fig. 6.
Current usage metrics show cumulative count of Article Views (full-text article views including HTML views, PDF and ePub downloads, according to the available data) and Abstracts Views on Vision4Press platform.
Data correspond to usage on the plateform after 2015. The current usage metrics is available 48-96 hours after online publication and is updated daily on week days.
Initial download of the metrics may take a while.