Fig. 2
Download original image
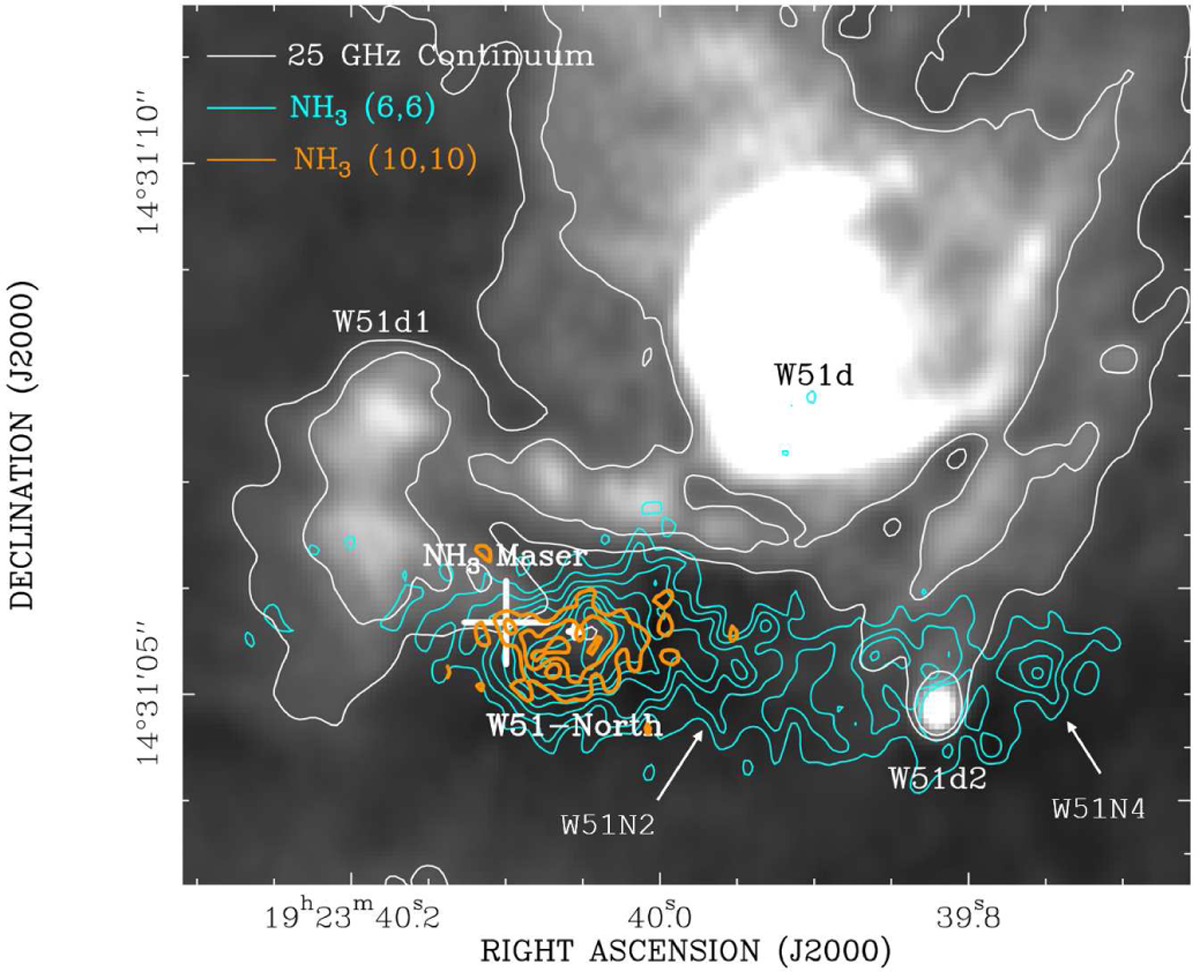
Overlay of the 25 GHz continuum emission (gray scale and white contours) and the integrated intensities of the quasi-thermal (6,6) and (10,10) lines of ammonia (taken from Goddi et al. 2015). The (6,6) contours show the elongated dense molecular environment at the southern boundary of the H II region W51d. The location of main molecular hotspots, W51N4, W51d2, W51N2, and W51-North (from west to east), are indicated. For more details, see Goddi et al. (2015).
Current usage metrics show cumulative count of Article Views (full-text article views including HTML views, PDF and ePub downloads, according to the available data) and Abstracts Views on Vision4Press platform.
Data correspond to usage on the plateform after 2015. The current usage metrics is available 48-96 hours after online publication and is updated daily on week days.
Initial download of the metrics may take a while.