Fig. 15
Download original image
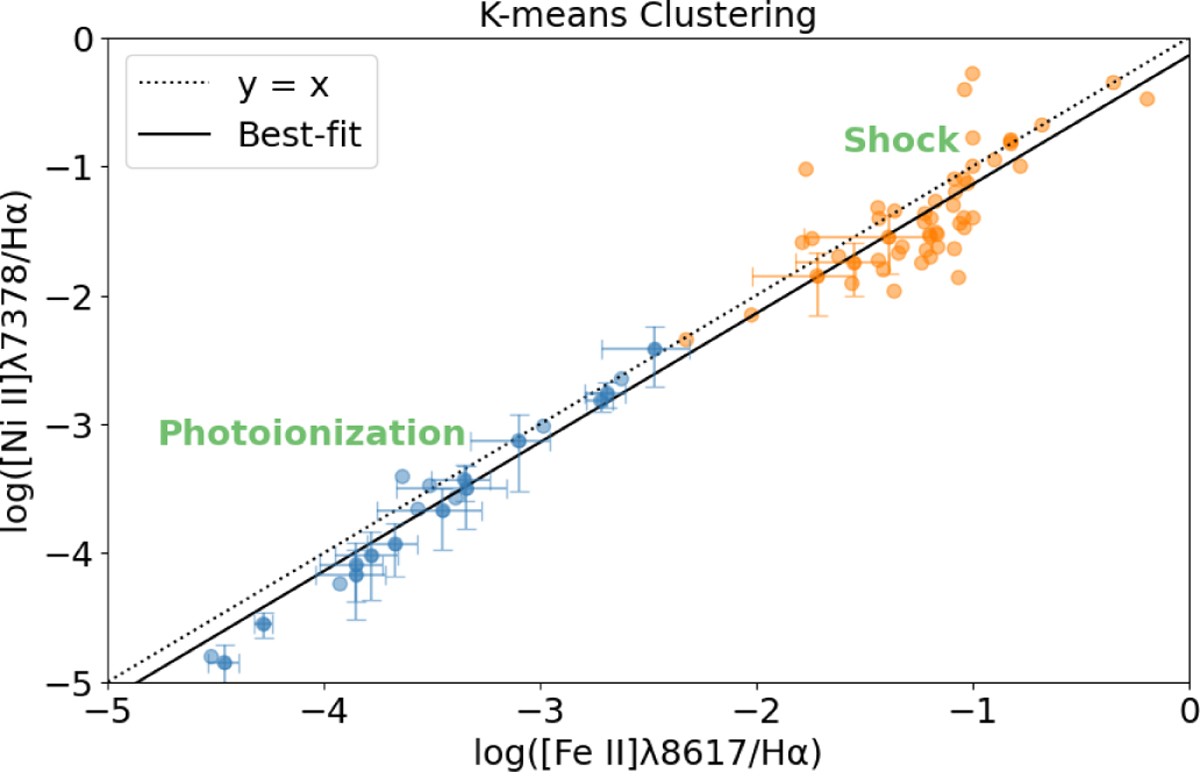
K-means clustering for log ([Ni II] 7378 Å/Hα) versus log ([Fe II] 8617 Å/Hα) diagram. Sources classified as shock-dominated are shown in orange, while photoionized sources are shown in blue. The least-squares best-fit line for all data is represented by a solid black line, and the one-to-one correlation is indicated by a dashed black line.
Current usage metrics show cumulative count of Article Views (full-text article views including HTML views, PDF and ePub downloads, according to the available data) and Abstracts Views on Vision4Press platform.
Data correspond to usage on the plateform after 2015. The current usage metrics is available 48-96 hours after online publication and is updated daily on week days.
Initial download of the metrics may take a while.