Fig. 19
Download original image
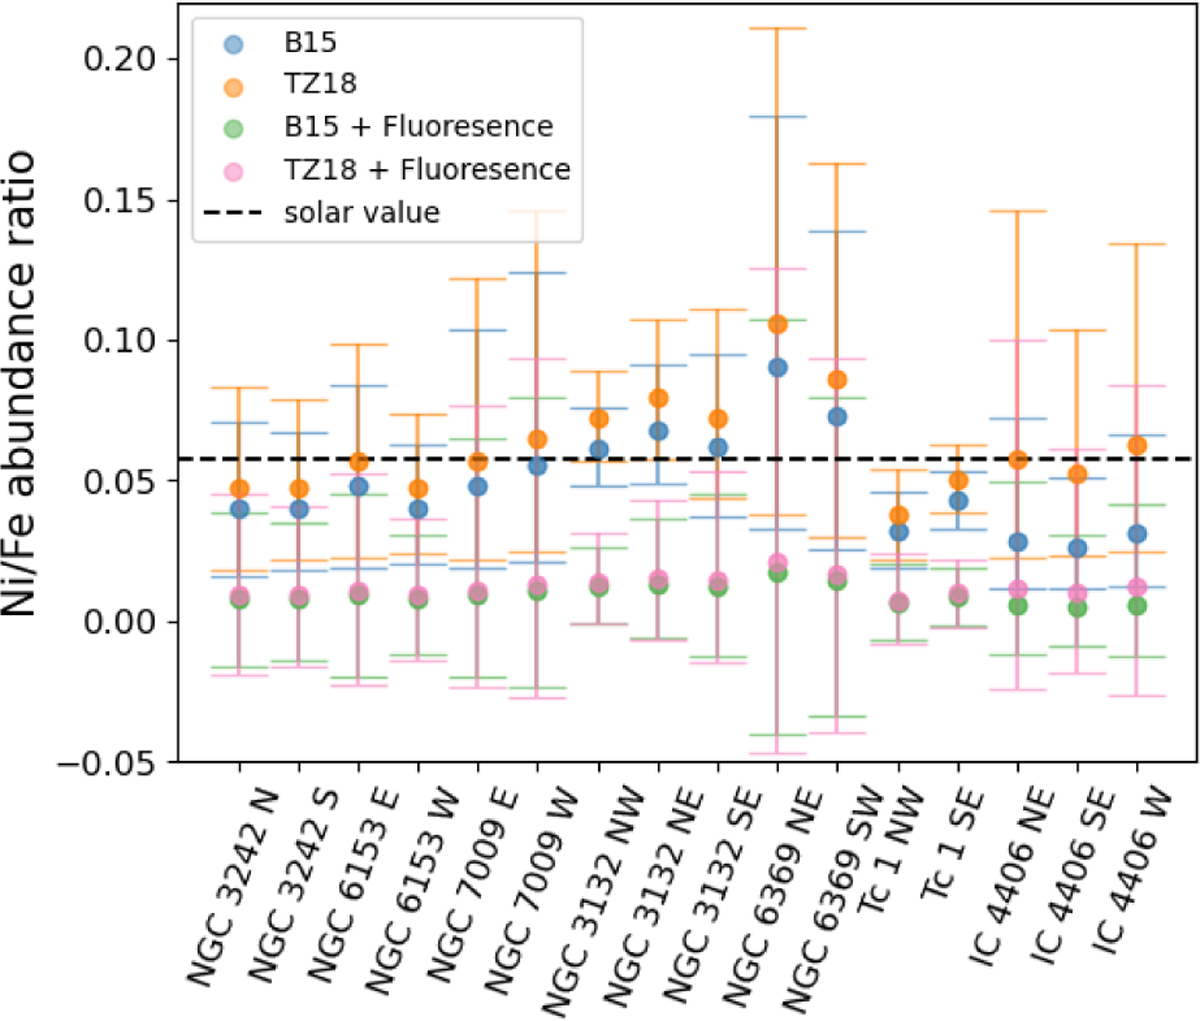
Ni/Fe abundance ratio for each clump in our sample of PNe. All the abundances have been calculated for Te = 10 000 K and ne = 1000 cm−3 and Chianty v10.1 atomic data for nickel. The dashed black horizontal line corresponds to the iron solar abundance from Lodders et al. (2009). Green and blue dots were estimated utilizing B15 atomic data, and the former account for fluorescence in nickel emission. Similarly, the pink and orange dots represent TZ18 atomic data.
Current usage metrics show cumulative count of Article Views (full-text article views including HTML views, PDF and ePub downloads, according to the available data) and Abstracts Views on Vision4Press platform.
Data correspond to usage on the plateform after 2015. The current usage metrics is available 48-96 hours after online publication and is updated daily on week days.
Initial download of the metrics may take a while.