Fig. 20
Download original image
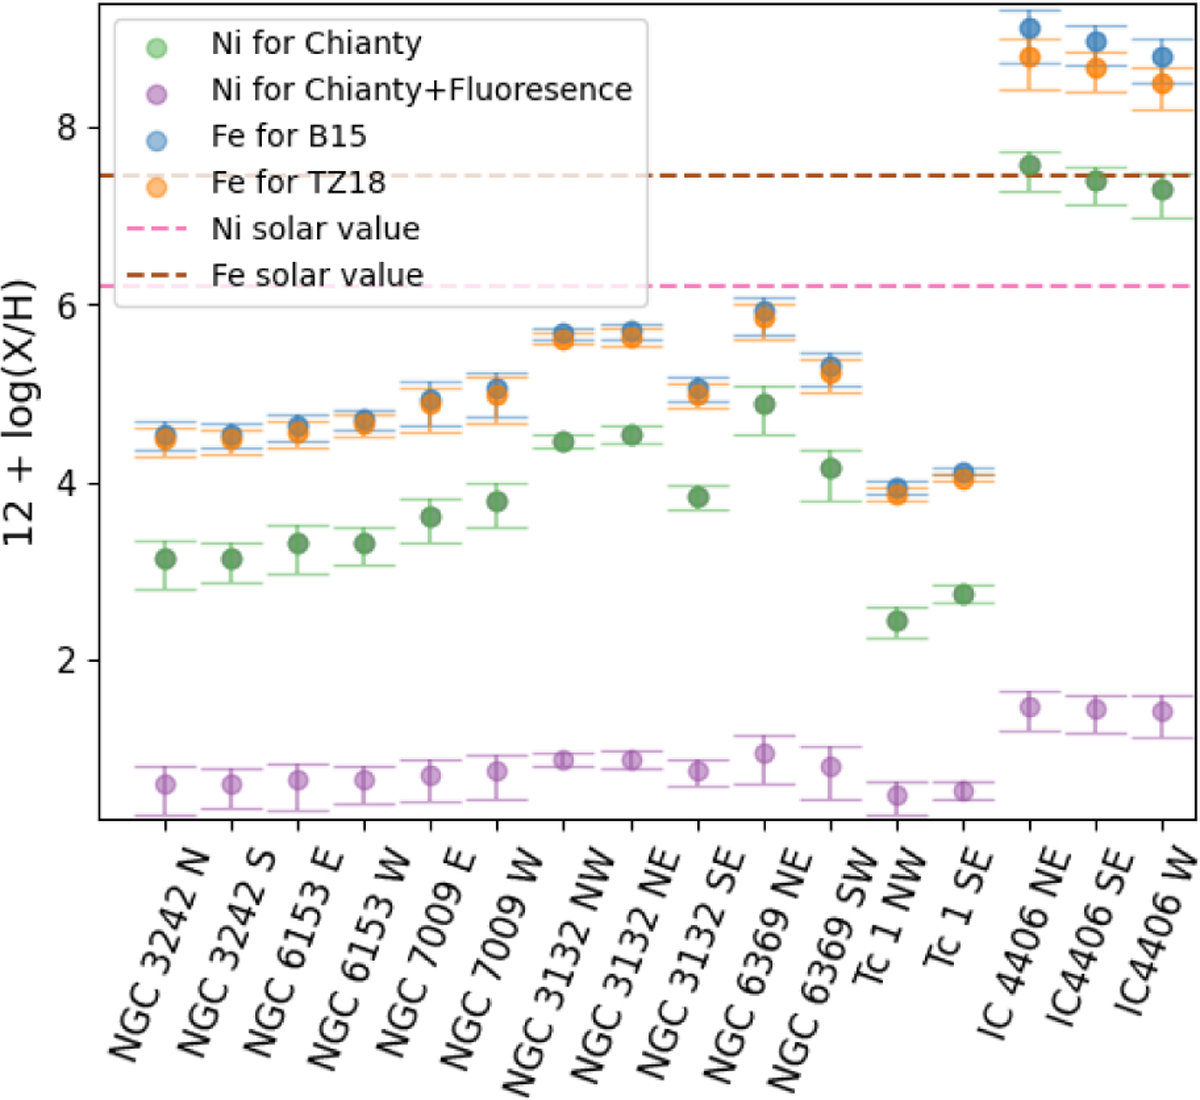
Ni and Fe abundances, assuming Ni/H = Ni+/H+and Fe/H = Fe+/H+, respectively. All the abundances were calculated for Te = 10 000 K and ne = 1000 cm−3 and Chianty v10.1 atomic data for nickel. The dashed pink and brown horizontal lines correspond to the solar abundance of nickel and iron, respectively. Green and purple dots correspond to nickel abundance, with the last ones accounting for fluorescence. Blue and orange dots corresponds to iron abundance utilizing B15 and TZ18 atomic data, respectively.
Current usage metrics show cumulative count of Article Views (full-text article views including HTML views, PDF and ePub downloads, according to the available data) and Abstracts Views on Vision4Press platform.
Data correspond to usage on the plateform after 2015. The current usage metrics is available 48-96 hours after online publication and is updated daily on week days.
Initial download of the metrics may take a while.