Fig. 21
Download original image
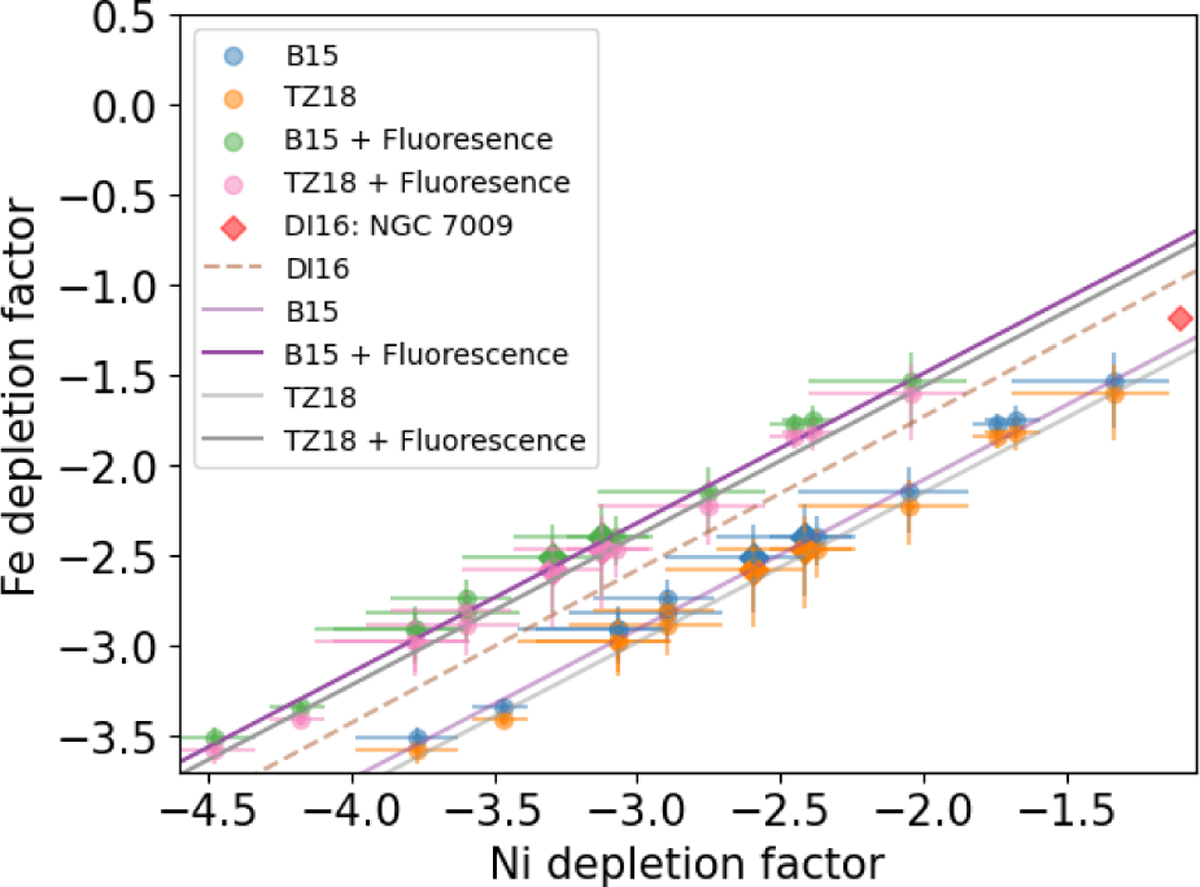
Ni depletion factor versus Fe depletion factor in clump regions within PNe. Diamond shapes correspond to NGC 7009 values. All the clump abundances were calculated for Te = 10 000 K and ne = 1000 cm−3. Solid lines correspond to best-fit lines for different iron atomic data and fluorescent cases for nickel. The dashed line shows the best fit from DI16. Green and blue dots were estimated accounting for fluorescence (or lack thereof) in nickel using B15 atomic data. The pink and orange dots were derived with the TZ18 atomic data.
Current usage metrics show cumulative count of Article Views (full-text article views including HTML views, PDF and ePub downloads, according to the available data) and Abstracts Views on Vision4Press platform.
Data correspond to usage on the plateform after 2015. The current usage metrics is available 48-96 hours after online publication and is updated daily on week days.
Initial download of the metrics may take a while.