Fig. B.1
Download original image
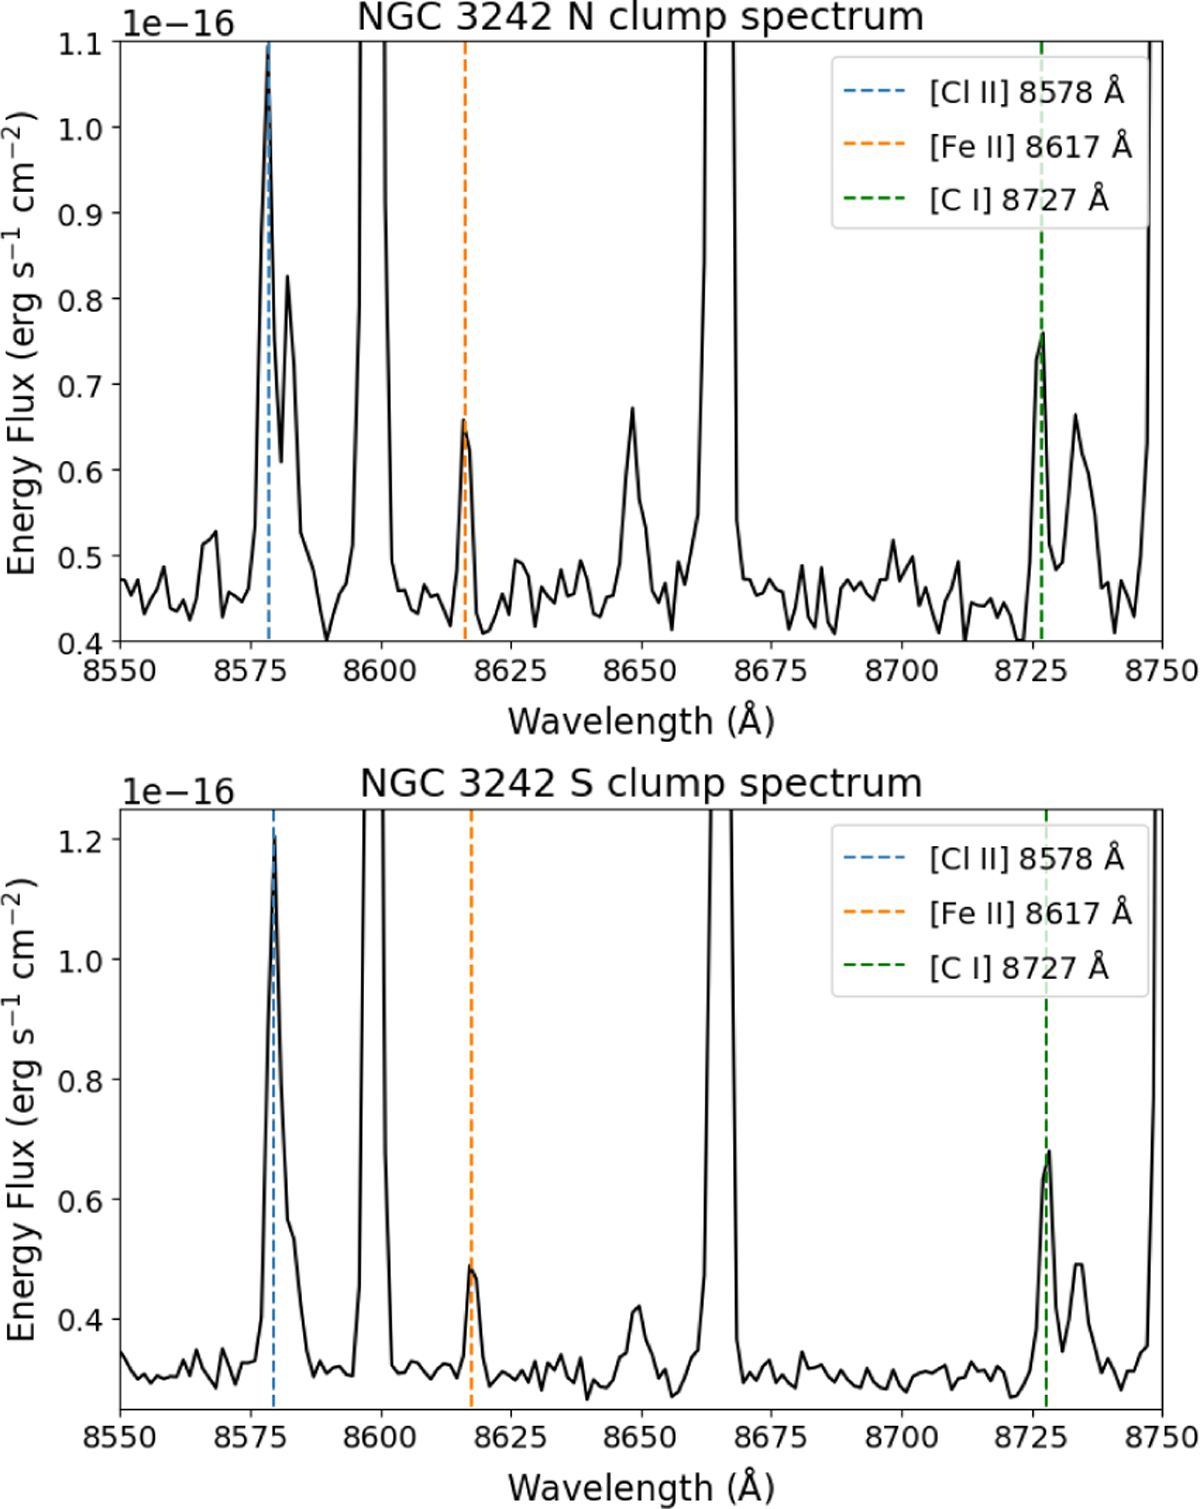
The spectrum of two nebular structures (N and S clumps) in NGC 3242. The [Cl II] 8578 Å, [Fe II] 8617 Å and [C I] 8727 Å emissions lines are indicated with blue, orange and green vertical dot lines, respectively. H I 8598 Å and 8665 Å, He I 8649 Å and 8733 Å emissions are also present in the plot. The number in the top left corner indicates the scaling factor applied in the y-axis values.
Current usage metrics show cumulative count of Article Views (full-text article views including HTML views, PDF and ePub downloads, according to the available data) and Abstracts Views on Vision4Press platform.
Data correspond to usage on the plateform after 2015. The current usage metrics is available 48-96 hours after online publication and is updated daily on week days.
Initial download of the metrics may take a while.