Fig. 6
Download original image
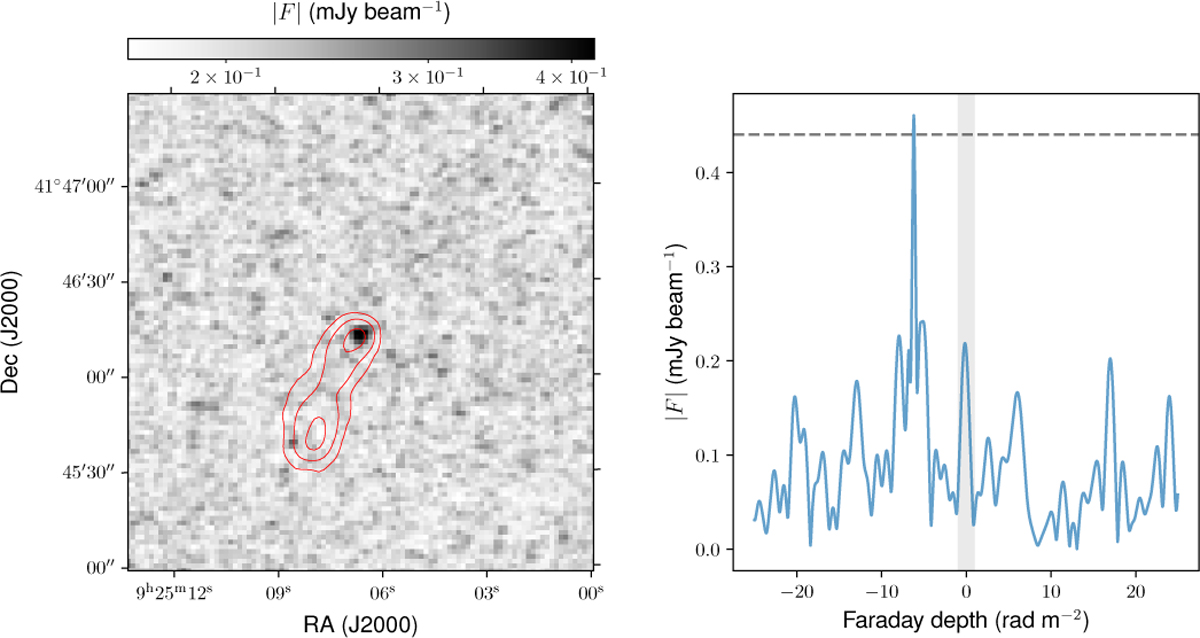
Polarized source previously not detected by OS23, found using our 3D reconstruction method. Left: polarized intensity map centered on the source. The Stokes I (10, 20, 50) × σI noise levels are shown as red contours. Right: magnitude of the LOS profile at the brightest pixel, with the local 8σQU level shown as a dashed black line. The shaded area indicates the range of Stokes I leakage between −1 and 1 rad m−2.
Current usage metrics show cumulative count of Article Views (full-text article views including HTML views, PDF and ePub downloads, according to the available data) and Abstracts Views on Vision4Press platform.
Data correspond to usage on the plateform after 2015. The current usage metrics is available 48-96 hours after online publication and is updated daily on week days.
Initial download of the metrics may take a while.