Open Access
Fig. 6
Download original image
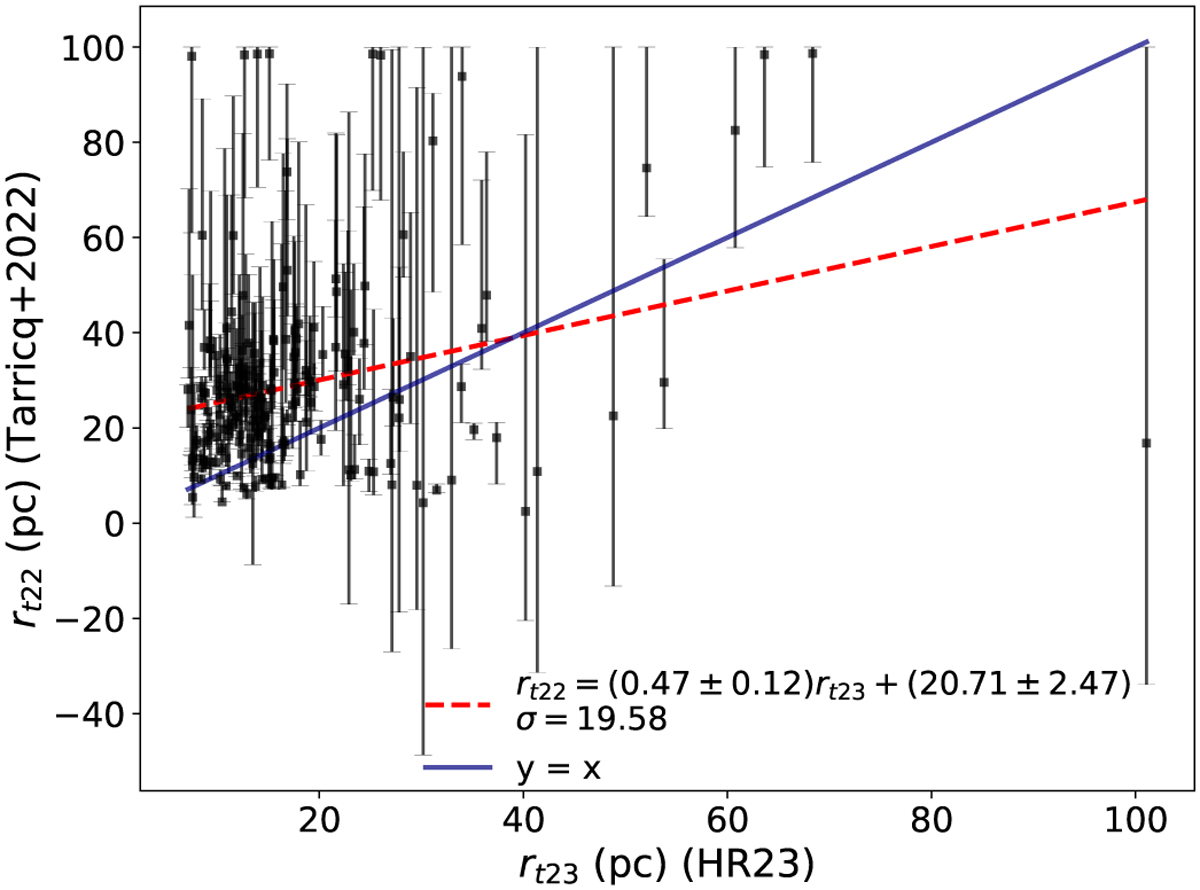
Comparison of tidal radii obtained by HR23 (rt23) and Tarricq et al. (2022) (rt22) for 202 clusters. The tidal radius errors are taken from Tarricq et al. (2022). The blue line shows the isoline, and the red line shows a linear fit to the correlation.
Current usage metrics show cumulative count of Article Views (full-text article views including HTML views, PDF and ePub downloads, according to the available data) and Abstracts Views on Vision4Press platform.
Data correspond to usage on the plateform after 2015. The current usage metrics is available 48-96 hours after online publication and is updated daily on week days.
Initial download of the metrics may take a while.