| Issue |
A&A
Volume 700, August 2025
|
|
|---|---|---|
| Article Number | A280 | |
| Number of page(s) | 12 | |
| Section | Galactic structure, stellar clusters and populations | |
| DOI | https://doi.org/10.1051/0004-6361/202554926 | |
| Published online | 28 August 2025 | |
A study of newly discovered close binary open cluster candidates in the Milky Way from Gaia DR3
Institute of Astronomy and Information, Dali University,
Dali
671003,
China
★ Corresponding author: This email address is being protected from spambots. You need JavaScript enabled to view it.
Received:
1
April
2025
Accepted:
9
July
2025
Abstract
Context. With the release of Gaia data, the number of known Galactic open clusters (OCs) has increased rapidly. This provides an excellent opportunity to confirm more binary OCs in the Milky Way.
Aims. Using a recently released OC catalogue, we employed the photometric and astrometric data of OCs and their member stars to find close binary open clusters (CBOCs).
Methods. Three-dimensional spatial coordinates, proper motions, and colour-magnitude diagrams were used to identify candidate CBOCs. The fundamental parameters of 26 star clusters were determined by fitting colour-magnitude diagrams to stellar population isochrones to confirm the similarity of reddenings, ages, and metallicities of the sub-clusters of candidate CBOCs. The virial equilibrium was then used to exclude false-positive CBOCs, including unbound moving groups. To further confirm the binary nature of the CBOC candidates, we calculated their Roche radii and orbital parameters. The tidal radius and radial velocity difference were then compared to the Roche radius and orbital velocity, respectively, to determine gravitationally bound pairs.
Results. We identified nine new CBOC candidates from bound candidate OCs, seven of which are shown to be candidates for primordial binary OCs. Only the pair CWNU 1024 and OCSN 82 was identified as a gravitationally bound CBOC when the uncertainties were considered, however. The other eight CBOC candidates appear to be gravitationally unbound pairs, but the results depend on the methods with which the tidal radius was determined and with which the gravitational binding was examined.
Key words: open clusters and associations: general / galaxies: clusters: general
© The Authors 2025
 Open Access article, published by EDP Sciences, under the terms of the Creative Commons Attribution License (https://creativecommons.org/licenses/by/4.0), which permits unrestricted use, distribution, and reproduction in any medium, provided the original work is properly cited.
This article is published in open access under the Subscribe to Open model. This email address is being protected from spambots. You need JavaScript enabled to view it. to support open access publication.
1 Introduction
Open clusters (OCs) result from the gravitational collapse of gas and dust in giant molecular clouds. Observational evidence suggests that a small fraction of them forms groups, such as pairs, triplets, or systems with an even higher multiplicity (Camargo et al. 2016) that are known as primordial binary open clusters (PBOCs). PBOCs are expected to be transient. Possible evolutionary paths include merging, tidal disruption, and separation (De Silva et al. 2015). Exploring Galactic binary open clusters (BOCs) provides new insights into the formation and evolution of star clusters and the Milky Way (Conrad et al. 2017).
There are some possible scenarios for the formation of binary star clusters: (i) simultaneous formation, in which both clusters form from the same molecular cloud (i.e. with a similar age and metallicity) and are located in close proximity (Fujimoto & Kumai 1997; Bekki et al. 2004) and (ii) sequential formation, in which stellar winds or supernova shocks generated within a cluster elicit the collapse of a nearby cloud, leading to the formation of a companion cluster (Brown et al. 1995). Another possible mechanism for the formation of BOCs is tidal capture, in which two clusters with different ages and metallicities form gravitationally bound pairs during a close encounter (de La Fuente Marcos & de La Fuente Marcos 2009; Camargo 2021). In addition, there are optical pairs that do not interact physically, but merely overlap in the line of sight.
A series of works used different OC catalogues to identify BOC candidates. Subramaniam et al. (1995) employed the OC catalogue published by Lynga (1995) to identify 18 candidate BOCs by applying the spatial separation criterion that the distance between the two clusters should be less than 20 pc. de La Fuente Marcos & de La Fuente Marcos (2009) used a volumelimited sample from the Open Cluster Database (WEBDA, Mermilliod & Paunzen 2003) and New Catalogue of Optically Visible Open Clusters and Candidates (NCOVOCC, Dias et al. 2002) catalogues that is located at the solar circle to identify candidate BOCs. The primary criterion they employed is that the physical (not projected) distance of the pair must be less than three times the average tidal radius of the clusters in the Milky Way disk (10 pc, according to Binney & Tremaine 2008). Based on this criterion, they concluded that at least 12% of all OCs within the solar circle appear to be experiencing some type of interaction with another cluster. Using the catalogue data published by Cantat-Gaudin & Anders (2020), Piecka & Paunzen (2021) identified 133 clusters that contained stars that were assigned to at least one other cluster. In these clusters, they identified 60 cluster aggregates. Using the Cantat-Gaudin et al. (2020) catalogue, Song et al. (2022) identified 14 candidate BOCs by comparing the proper motions and colour-magnitude diagrams (CMDs) of different clusters, limited to a separation of 50 pc. Camargo (2021) used 2MASS (Skrutskie et al. 2006) and Gaia EDR3 (Gaia Collaboration 2021) data to confirm a BOC (NGC 1605a and NGC 1605b) that formed via tidal capture, based on their close proximity and similar dynamics. The result was quickly rejected, however, because Anders et al. (2022) re-analysed the Gaia EDR3 data and found no evidence that NGC 1605 is a BOC.
Although significant progress has been made in studying BOCs, the exact fraction of BOCs in the Milky Way remains unclear. Observations and simulations produce differing results. The proportion of BOCs in the Milky Way was estimated to be 8–12% (Subramaniam et al. 1995; de La Fuente Marcos & de La Fuente Marcos 2009), which is similar to that in the Magellanic Cloud (Bhatia & Hatzidimitriou 1988; Hatzidimitriou & Bhatia 1990; Dieball et al. 2002). All of the above results are based on observed data, meaning that they depend on the quality and extent of the input dataset. Conclusions based on numerical simulations depend less on Gaia or are even completely independent of it, however. Gaia is helping to confirm or reject predictions from numerical modelling. In the particular case of BOCs, numerical simulations (Portegies Zwart & Rusli 2007; de la Fuente Marcos & de la Fuente Marcos 2010; Priyatikanto et al. 2016) suggested that star cluster binarity is a temporary, relatively short-lived state that is mainly linked to the early stages in the evolution of star-forming regions. Based on this, a small but statistically significant fraction of BOCs (and even higher-multiplicity) would be expected among the young stars, but a rather small fraction for the overall star cluster population. In a larger sample (post-Gaia), the true fraction of BOCs approaches 1% (instead of to the pre-Gaia 10%). This is fully consistent with the results from numerical simulations (binarity for star clusters is transient).
Gaia-DR3 (Gaia Collaboration 2023b) provides high-precision five-dimensional astrometric parameters (positions, parallax, and proper motions) and three-band photometry (G, GBP and GRP) for 1.5 billion sources. Based on the vast and precise Gaia data, more OCs are being discovered (see recent works, e.g. Hunt & Reffert 2023; Qin et al. 2023; Li & Mao 2024). In particular, Hunt & Reffert (2023, hereafter HR23) provided a homogenised catalogue containing 7167 clusters. We use the larger OC sample (HR23) to search for close binary open clusters (CBOCs). The structure of this paper is as follows: Sect. 2 presents the data we used to search for new candidate CBOCs, Sect. 3 introduces the method we employed, Sect. 4 reports the results and analyses the properties of the newly discovered candidate CBOCs, and Sect. 5 summarises this work and discusses the limitations of the method and the data.
2 Data
We took the HR23 catalogue for this work because it is one of the newest and largest OC catalogues. The HDBSACN algorithm was used by HR23 to conduct a blind all-sky search for OCs based on 729 million sources with a stellar magnitude brighter than 20 in Gaia Data Release 3 (DR3) (Gaia Collaboration 2023a). Then the variational inference Bayesian convolutional neural network trained by unbiased and representative CMD pixel images of OC samples was used to verify the clusters identified by HDBSACN. A homogenised cluster catalogue was finally obtained by HR23 that includes 7167 clusters, 2387 of which are newly discovered. HR23 also provided the fundamental astronomical parameters of clusters, such as age, extinction, distance, and tidal radius in the catalogue.
3 Method
Similar to previous works, we confirmed BOC candidates based on the similarity of two sub-clusters in proper motion and spatial distribution space using a novel technique. To facilitate calculating the distance between two sub-clusters, we first computed the three-dimensional spatial coordinates of the cluster centres and member stars of clusters based on data on the right ascension, declination, and parallax (RA, Dec, and ω). While HR23 provided the galactocentric coordinates of cluster centres in XYZ space, similar data for their member stars are lacking. We therefore first computed the X, Y, and Z values. We then calculated the absolute distance between the centres of two sub-clusters and verified whether the cluster pair was a BOC candidate via the distance. In previous works (de La Fuente Marcos & de La Fuente Marcos 2009; Conrad et al. 2017), the critical distance between the two sub-clusters of a BOC candidate was taken as values from 30 to 100 pc. A larger critical distance will help to find more preliminary BOC candidates. These fixed critical distances alone contain a disadvantage, however, because it cannot be judged whether a pair is a close pair as the sizes of star clusters are usually different. We therefore used a relative distance, that is, the sum of the total tidal radii of two sub-clusters (r1 + r2), to determine CBOC candidates. When the distance between two cluster centres (d12) was smaller than the sum of the tidal radii (r1 + r2), that is, d12 ≤ r1 + r2 (see Fig. 1), we considered this pair of clusters to be a CBOC candidate. When the distance was too small, however, the two sub-clusters possibly belong to the same cluster. Two sub-clusters that are closer than 0.5 times their minimum radius (d12 < 0.5 min(r1, r2)) are regarded as the same cluster here. This is reasonable because the intersection of the two sub-clusters is more than half the size of the smaller cluster in this case.
In addition to the similar spatial position, BOC candidates usually have similar proper motions. Song et al. (2022) suggested that two sub-clusters share a common proper motion if their proper motions are consistent within an error range of 3σ. This restriction is relatively lenient and may lead to a large difference in the proper motion. We used a new method and compared the distance between the central proper motions (Dpm) of two subclusters and the maximum 1σ error in proper motion. When Dpm is smaller than the maximum 1σ error, that is, Dpm < max(σ1pm, σ2pm), the two sub-clusters have a similar proper motion (see Fig. 2). This constraint on the proper motions of two sub-clusters is stricter than that of Song et al. (2022), but it makes the results more reliable.
Through this process, we found 116 preliminary BOC candidates. We found that many clusters formed groups with more than two clusters, however, which we refer to as cluster aggregates. In the following binary analysis, we eliminated all cluster aggregates. This work only investigates cluster pairs that are composed of two sub-clusters. The membership and characteristics of cluster aggregates will be examined in future works.
In addition, we verified whether a BOC candidate included a moving group or an unbound object. We also verified whether a BOC candidate was gravitationally bound. The one-dimensional velocity dispersion (σ1D) was compared to the velocity dispersion, which is needed for virial equilibrium (σvir), to determine whether a cluster candidate was bound. The radial velocity difference (∆ RV) of a pair was compared to the orbital velocity (Vorb) to determine whether a pair was gravitationally bound, and the result was verified by comparing the Roche and tidal radii of a cluster.
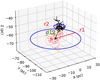 |
Fig. 1 CBOC assessment. Two clusters with d12 ≤ r1 + r2 are considered a close pair. d12 is the distance between two cluster centres. r1 and r2 are the tidal radii of two clusters. |
Spatial positions of the 13 newly discovered candidate CBOCs.
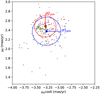 |
Fig. 2 Proper motion similarity assessment. Two clusters with Dpm < max(σ1pm,σ2pm) are thought to have common proper motion. Dpm is the distance between the proper motion centres of two clusters. σ1pm and σ2pm are the σ values of two clusters. |
4 Results
4.1 Newly found candidate CBOCs and their properties
Based on the similarity of the spatial position and proper motions of the members of cluster pairs in HR23, we found dozens of probable candidate CBOCs. Fig. 3 shows the classification of all cluster pairs. Some of the candidate CBOCs were reported in previous works. The results were then cross-matched to the known list of BOCs or BOC candidates (Subramaniam et al. 1995; Loktin 1997; de La Fuente Marcos & de La Fuente Marcos 2009; Conrad et al. 2017; Piecka & Paunzen 2021). When a member of a probable candidate CBOC was listed as a subcluster of a known BOC or candidate, the candidate CBOC was considered known. Many known binary clusters such as Alessi 43 and Collinder 197 were removed from the list of newly discovered candidate CBOCs. As a result, we identified 16 candidates for CBOCs. Three other candidates (HSC 633 and HSC 673, HSC 865 and HSC 958, and HSC 1743 and Theia 267) were removed from the candidate CBOC list because their member clusters HSC 633, HSC 958, and HSC 1743 are classified as moving groups rather than OCs by HR23. We finally obtained 13 CBOC candidates. Table 1 lists their spatial positions. The fundamental parameters of these CBOCs including colour excess, age, metallicity, and distance modulus were derived from fitting the CMDs to the PARSEC 1.2s isochrones (Bressan et al. 2012) via a GPU version of the powerful CMD code (Li et al. 2017). The code divides the CMD of star clusters into 1500 cells, including 50 colour bins and 30 magnitude bins, and uses a weight-average difference (WAD) to assess the goodness of fit (Li et al. 2017; Deng & Li 2024). The WAD is calculated using the formula
 (1)
(1)
where ωi is the weight of the ith cell, and fob and fh are star fractions of observed and theoretical CMDs in the same cell, respectively. ωi relates to the stellar completeness of each cell and was set to 1 in this work. The parameters of stellar population models with the lowest WAD value were taken as the best-fit results. In order to mitigate the effects of photometric uncertainty, we generated 20 CMDs randomly by taking the typical uncertainties in observational magnitudes into account and fit them one by one. The resulting uncertainties were then calculated from the 20 series of best-fit parameters. This is introduced in more detail below. These fundamental parameters are listed in Table 2.
Fig. 4 compares the best-fitting isochrones of two subclusters of the 13 candidate CBOCs. The observed CMDs, proper motion distributions, parallax distributions, and twodimensional coordinates of these candidates are also shown. The distance modulus, colour excess, age, and metallicity values of the clusters are reported as determined by the code powerful CMD, and the parallax, proper motions, radial velocity (RV), and number of members (prob > 0.7) were taken from HR23. The results are clearly consistent with CBOCs, which suggests that the method we used is reliable.
When the ages and metallicities of two sub-clusters are similar (age difference <50 Myr and [Fe/H] difference <0.05 dex), the two sub-clusters may have originated from the same molecular cloud. These CBOC candidates can be assigned to PBOCs, and candidates with large difference in the ages and metallicities should be excluded from PBOCs. After we determined the age and metallicity differences of the 13 candidate CBOCs, 9 candidates were assigned PBOC candidates, as listed in Table 2. The critical age and metallicity differences were set to slightly higher values than in some previous works because the uncertainties seemed somewhat large in the CMD fitting.
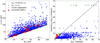 |
Fig. 3 Classification of all cluster pairs. The orange dots indicate pairs whose member clusters may belong to the same cluster. The blue dots indicate pairs whose separations are smaller than the sum of the tidal radii of member clusters and whose proper motions differ clearly. The green points denote cluster aggregates. The red triangles indicate CBOC candidates. |
Fundamental parameters and astrometric information for the 13 newly discovered candidate CBOCs.
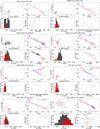 |
Fig. 5 Distributions of PMs, CMDs, parallaxes, and celestial position of member stars of nine newly found candidate CBOCs. In the panels except for the CMD, black and red show the two sub-clusters. In the CMD panel, blue and red and crosses and points show the observed stars and best-fit isochrones. The error bars show the median uncertainties (from the Gaia report) in proper motion, magnitudes, and parallax at 20 mag and in the coordinates (from all member stars of a cluster). |
4.2 Deletion of candidates that include a moving group
Although we eliminated sources that were classified as moving groups by HR23 at the beginning, many objects still remained that were more compatible with unbound moving groups in the OC sample (Hunt & Reffert 2023). It was therefore necessary to demonstrate that two objects in a BOC candidate are gravitationally bound. We applied the method of Kuhn et al. (2019) to the 13 candidate CBOCs.
We calculate the one-dimensional velocity dispersions, σ1D, and the velocity dispersions that are needed for virial equilibrium, σvir, in this section following Kuhn et al. (2019). The one-dimensional velocity dispersion is calculated by taking the mean variance of multi-dimensional velocity dispersions,
 (2)
(2)
where σpc1 and σpc2 are the semi-major and semi-minor axes of the ellipse of proper motions. This ellipse includes 68.3 percent of the member stars of a star cluster, that is, it includes stars that are within the 1σ error on the proper motion. The directions of two components of the velocity dispersion were calculated by a principal component analysis (PCA). pc1 and pc2 denote the directions of the first and second component of the PCA.
The velocity dispersion that is needed for virial equilibrium is calculated by the equation
 (3)
(3)
where G is the gravitational constant, and η is the mass profile parameter. A Plummer model yields η ≈ 10 (Portegies Zwart et al. 2010), but many young clusters have η <10. In this case, we took two values (10 and 5) for η. Mass and rhm are the mass and half-mass radius of the system, respectively. We fitted the observed CMD of a cluster to the CMDs of stellar populations with different IMFs to estimate the stellar mass. The half-light radii (rhm) were calculated using the masses of HR23 because both the masses and positions of stars were given. When a system has  , its total energy would be positive and the system would be unbound. We therefore give the values for
  .
.
The results are shown in Table 3, which also lists the gravitational status of the cluster candidates. Objects with  were assigned to be bound (B), while those with
  were assigned to be unbound (U) when taking both η values. When a system had
  , the object was thought to be uncertain (O) (see e.g. ADS 16795; this is similar to the result of Allen et al. 2018). Four candidate CBOCs, that is, ADS 16795 and HSC 976, HSC 477 and HSC 759, HSC 1630 and HSC 1644, and HSC 2204 and OC 0508, were excluded from the candidate CBOC list because at least one member of them might be unbound based on the comparison of σ1D and
  .
.
4.3 Identification of bound pairs
In previous works (de La Fuente Marcos & de La Fuente Marcos 2009; Song et al. 2022), the authors determined whether cluster pairs constituted physically BOCs based on parameters such as spatial proximity and based on a similarity in age, metallic-ity, proper motion, and parallax. This information is not enough for a definitive confirmation, however, because we do not know which pairs are gravitationally bound. We therefore performed a deeper confirmation with the reliable method of Minniti et al. (2004). We calculated the cluster mass, Roche radius, and orbital velocity for the confirmation.
4.3.1 Cluster mass
Gaia DR3 supplies important data, including the proper motions and the radial velocities of the stars, and it estimates the corresponding parameters of star clusters. It is still challenging to estimate the masses of clusters, which are necessary for calculating the Roche radius and orbital velocity of star clusters. The two parameters are important to determine whether cluster pairs are bound or unbound. Many different methods for determining the cluster mass were employed in researches. The main methods include the King profile method (King 1962), the virial theorem (McNamara & Sanders 1983), and the integrated stellar luminosity function (Piskunov et al. 2008).
We used the stellar population models with the Kroupa initial mass function (IMF) (Kroupa 2001) to estimate the cluster masses and their errors. We used stellar isochrones of PARSEC 1.2s (Bressan et al. 2012), which include 15 metallicities (Z = 0.0001, 0.0002, 0.0005, 0.001, 0.002, 0.004, 0.006, 0.008, 0.01, 0.014, 0.017, 0.02, 0.03, 0.04, and 0.06) and 1200 ages from 1 and 5996 Myr with a step of 5 Myr to build stellar populations.
In order to estimate the masses of star clusters more reliably, we constructed a series of stellar population models with IMF slopes (Γ) that covered the range from 1.6 to 2.4 with a step of 0.1. The masses of the star clusters were derived by fitting the theoretically constructed CMDs of stellar population models to observational data. We obtained nine mass values for each cluster, corresponding to the nine IMF slopes. The mass includes the mass of all artificial stars with initial masses between 0.08 and 120 M⊙. Because this mass is the initial mass, the current mass is somewhat lower. We then calculated the 1σ error of mass of a cluster from the nine fitted mass values. Based on the stellar population models with the best-fit IMF slope, we fitted the CMD of each cluster again. We generated 20 CMDs randomly by taking the typical uncertainties in observational magnitudes (0.006, 0.108, and 0.052 mag for G, GBP, and GRP respectively) into account and fitted them using the theoretical stellar populations. We obtained 20 series of best-fit parameters (including age) and the standard deviation (i.e. σ value) for each parameter. These σ values were then taken as the parameter uncertainties. We refer to Weisz et al. (2015) for a similar application of various IMF slopes to determine cluster parameters. The masses of the clusters are listed in Table 4. The ages and masses of clusters we derived are compared with some values from the recent literature in Appendix A.
One-dimensional velocity dispersions (σ1D) and velocity dispersions needed for the virial equilibrium (σvir10 and σvir5) of the 26 cluster candidates.
Parameters for determining gravitationally bound and unbound cluster pairs.
4.3.2 Roche radius and orbital velocity
This section calculates the Roche radius (Rroche) and orbital velocity (Vorb) of each cluster pair. We calculated Rroche and Vorb using the same equations as Minniti et al. (2004). For a cluster pair, the relevant size of the Roche radius was calculated as
![Mathematical equation: R_{\rm roche} = a[0.38+0.2\log(m_{1}/m_{2})] ^{1/2},](/articles/aa/full_html/2025/08/aa54926-25/aa54926-25-eq118.png) (4)
(4)
where a is the semi-major orbital axis, and m1 and m2 are the masses of two sub-clusters. a was roughly taken to be the distance between the centres of two sub-clusters. The masses of clusters were taken from Table 4. We estimated the errors in the distances between cluster pairs and in the tidal radii based on the errors in RA, Dec, and ω provided by HR23. We then calculated the errors in other parameters, for instance that in Rroche, based on the error in distance, according to the error propagation formula. Systematic errors were not taken into account here.
The Roche radii Rroche can be compared to the tidal radii to determine whether two sub-clusters are gravitationally bound. For a bound pair, the Rroche should be smaller than the tidal radius for each sub-cluster.
When a cluster pair is bound, the expected orbital period in years (Porb) is
 (5)
(5)
where a is the semi-major axis in pc, and m1 and m2 are the masses of the two sub-clusters in M⊙.
The orbital velocity can be computed by
 (6)
(6)
where a is in km and Porb in s. This leads to Vorb values in km s−1. Considering sini and the orbital phase factor, Vorb should be the maximum velocity difference between two sub-clusters. Because HR23 reports the RVs of clusters, we computed the radial velocity difference of the sub-clusters in each pair, ∆ RV, and compared it with Vorb.
4.4 Analysis of nine candidate CBOCs
In this section, we analyse the nine candidate CBOCs in which we might search for gravitationally bound cluster pairs, that is, binary clusters. The comparison of orbital velocity and radial velocity differences indicated that eight pairs except for CWNU 2666 and HSC 224 are gravitationally bound at the 1σ level (see Table 4), because ∆RV is smaller than Vorb. The 1σ errors in the cluster parameters were taken into account in the comparisons. The results needed to be rechecked by comparing the Roche radius and tidal radius of each sub-cluster because of the large uncertainties in the radial velocities, however. Moreover, we also analysed the metallicities and ages of sub-clusters of the nine candidate CBOCs. This is useful for more detailed future studies of the formation of these pairs.
4.4.1 ASCC 100 and HSC 534
For the pair ASCC 100 and HSC 534, the difference in RV, that is, ∆RV, is 10.54 ± 14.56 km s−1. It can be smaller than the orbital velocity Vorb (0.58 ± 0.0011 km s−1) when the uncertainties are taken into account. Rroche of sub-cluster HSC 534 (12.96 ± 0.35 pc) is larger than its tidal radius (10.39 ± 0.09 pc), however. This suggests that this pair is not bound. The CMDs of clusters ASCC 100 and HSC 534 have almost the same isochrone. Our results show that their ages and metallicities are similar. Because the tidal radius results from different works differ strongly, ASCC 100 and HSC 534 might be a PBOC.
4.4.2 BDSB 93 and HSC 1740
For the pair BDSB 93 and HSC 1740, the Rroche of subcluster HSC 1740 (18.71 ± 0.30 pc) is larger than the tidal radius (7.64 ± 0.32 pc). This means that this pair is not bound. The age of HSC 1740 is 8 Myr based on the HR23 results, which agrees with our result of 13 Myr. BDSB 93 is also a young OC with an age of 37 Myr. If this pair is a binary cluster, it is a PBOC.
4.4.3 CWNU 1024 and OCSN 82
HR23 reported the RVs of CWNU 1024 and OCSN 82 as 21.59±12.65km s−1 and 15.47±10.47km s−1, respectively. Qin et al. (2023) similarly reported the RV for OCSN 82 as 18.22 km s−1, which, is slightly different from the result of HR23. The estimated Roche radii (43.27 ± 1.14pc for CWNU 1024 and 31.51 ± 1.56 pc) are smaller than the tidal radius (61.10 ± 2.71 pc for CWNU 1024 and 29.60 ± 0.68 pc OCSN 82) for the two sub-clusters when the uncertainties are taken into account. The pair of CWNU 1024 and OCSN 82 is therefore likely to be a gravitationally bound system. In addition, the CMDs of CWNU 1024 and OCSN 82 overlap and share almost the same isochrone, suggesting that they are similar in age, metallicity, and distance modulus. These characteristics suggest that CWNU 1024 and OCSN 82 may be a PBOC.
4.4.4 CWNU1173 and CWNU 1256
For the pair of CWNU1173 and CWNU 1256, the Roche radius of sub-cluster CWNU 1256 (24.33 ± 2.41 pc) is greater than the tidal radius (13.88 ± 1.34 pc). This pair is probably not bound. He et al. (2022) reported the ages of CWNU 1173 and CWNU 1256 as 22 Myr and 35 Myr, respectively. The ages derived from the isochrone fitting in this work seem somewhat older (98 Myr), but the difference is within acceptable limits when the age uncertainties are taken into account. This can also be listed as a candidate PBOC because the uncertainties on the tidal radii of the clusters are large (up to 20 pc).
4.4.5 CWNU 2666 and HSC 224
For the pair CWNU 2666 and HSC 224, the Roche radius of sub-cluster CWNU 2666 (15.12 ± 2.08 pc) is larger than its tidal radius (6.99 ± 0.34 pc). This pair appears not to be bound. HR23 reported ages of 98 Myr and 64 Myr for CWNU 2666 and HSC 224. Cavallo et al. (2024) similarly reported their ages as 54 Myr and 50 Myr. He et al. (2023) reported the age of CWNU 2666 as 50 Myr. In previous studies, their ages did not exceed 100 Myr. The ages we obtained are older than 1 Gyr, however. We studied the CMDs of two clusters and found that a few stars in the upper right corner of the main sequence leads to the older ages. The CMD we used is different from that in previous works. In order to investigate the difference, we compared our results with those by Cavallo et al. (2024). The Av values were estimated by fitting the relations Av = 3.1 E(B – V) and E(G – GRP) = 0.705 E(B - V) (Casagrande & VandenBerg 2018). The extinction, metallicity, and distance modulus of CWNU 2666 are 1.45 mag, 0.0085, and 11.36 mag, while those of HSC 224 are 0.87 mag, 0.0085, and 10.68 mag, respectively. The values reported by Cavallo et al. (2024) are 2.86 mag, 0.0246, and 11.18 mag for CWNU 2666, and 2.21 mag, 0.0459, and 11.51 mag for HSC 224. The extinctions and metallicities obtained by different works differ clearly. This suggests that the identification of member stars affects the stellar population parameters significantly.
4.4.6 HSC 189 and UPK 24
In the pair of HSC 189 and UPK 24, the Roche radius of HSC 189 (30.00 ± 1.22 pc) is larger than its tidal radius (24.62 ± 0.67 pc), suggesting that this pair is likely not bound. HR23 reports an age of 125 Myr for HSC 189. The age of UPK 24 varies in different catalogues, with ages reported as 1047 Myr (Dias et al. 2021), 269 Myr (Cantat-Gaudin et al. 2020), and 282 Myr (Tarricq et al. 2022). The oldest result exceeds 1 Gyr. Based on the data reported in the catalogues, the ages of these two OCs differ significantly. Our results confirm this (see Table 2). The pair HSC 189 and UPK 24 is certainly not a PBOC.
4.4.7 HSC 1897 and HSC 1911
For the pair HSC 1897 and HSC 1911, the Roche radius of HSC 1897 (30.05 ± 1.02 pc) is larger than its tidal radius (24.50 ± 1.16 pc). The two sub-clusters have similar metallicities and ages (see Table 2). This suggests that this is not a bound pair, but a primordial pair.
4.4.8 HSC 2468 and HSC 2505
The pair HSC 2468 and HSC 2505 seems to be unbound because the Roche radius of HSC 2505 (14.69 ± 0.66 pc) is larger than its tidal radius (5.48 ± 0.17 pc). This is an unbound pair. The ages and metallicities of the two sub-clusters are similar, as shown in Table 2.
4.4.9 HSC 2571 and Platais 12
For the pair HSC 2571 and Platais 12, Loktin & Popova (2017) provided an RV of −12.0 km s−1 for cluster Platais 12, which essentially agrees with the HR23 result of −12.25 ± 8.16 km s−1. HSC 2571 has an RV of −8.93 ± 7.52 km s−1. The RV difference suggests that this pair might be bound. The Roche radius of HSC 2571 (24.70 ± 1.42 pc) is larger than its tidal radius (14.33 ± 0.64 pc), however, suggesting that this pair is not gravitationally bound. The age of Platais 12 ranges from 79 Myr (He et al. 2022) to 169 Myr (Loktin & Popova 2017). We obtained an age of 162 Myr by CMD fitting, which is consistent with the results of Loktin & Popova (2017). Both HSC 2571 and Platais 12 are young OCs of the same age. This means that this is a candidate primordial pair, but not a bound pair.
Fig. 5 shows the distribution of cluster pairs in the space of age difference versus ratio of Rroche to the tidal radius for each cluster. When a pair of clusters differs in age by less than 50 Myr (horizontal dotted black line) and the ratios of Rroche to the tidal radius are lower than 1 (vertical dotted black line), the pair is considered a PBOC candidate. In summary, when the 1σ uncertainties in mass, distance, and tidal radius are taken into account, a candidate cluster pair (CWNU 1024 and OCSN 82) is suggested to be a bound binary cluster at the level of 1σ. It remains unclear whether the other eight pairs are gravitationally bound because of the large uncertainties in tidal radii and radial velocities. The tidal radii of the clusters in the catalogue HR23 are much smaller than in other works (e.g. Tarricq et al. 2022). Hunt & Reffert (2023) showed that the tidal radii of most clusters of a test sample of 202 clusters ranged from 20 to 100 pc based on the results of Tarricq et al. (2022), but ranged from 0 to 20 pc based on the results of HR23. The catalogue of Tarricq et al. (2022) only includes one of the star clusters we investigated, however. In order to quantify the difference between the estimates of the cluster tidal radii in the two works, we compared the tidal radii of a sample of 202 clusters and fitted their correlation using the least-squares method, as shown in Fig. 6. When this loose correlation is used to correct for the tidal radii of HR23, the values should increase by at least 17. This suggests that all nine cluster pairs in this work are gravitationally bound.
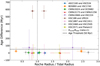 |
Fig. 5 Distribution of cluster pairs in the space of age difference vs. ratio of Rroche to the tidal radius for each cluster. The sub-clusters of a pair are shown in the same colour and shapes. When two sub-clusters of a pair differ in age by less than 50 Myr (horizontal dotted black line) and the ratio of Rroche to tidal radius of each sub-cluster is lower than 1 (vertical dotted black line), it is considered a PBOC. |
5 Discussion and conclusion
We used three-dimensional spatial data, two-dimensional proper motion data, and colour-magnitude data of the OCs from a recently published cluster catalogue (HR23) to conduct a comprehensive search for close binary open clusters (CBOCs) in the Milky Way. The member stars of a close binary star cluster are thought to have similar proper motions and radial velocities. A genuine binary cluster must satisfy two conditions: (1) each subcluster must be gravitationally bound, and (2) the pair must be gravitationally bound. We used the methods of Minniti et al. (2004) and Kuhn et al. (2019) to determine bound clusters and bound cluster pairs. We ultimately identified 9 candidate CBOCs from the HR23 catalogue, one pair of which is suggested to be a certain primordial binary cluster by the data. Some of the other eight pairs are also potential bound pairs when alternative tidal radius determinations are considered (e.g. Tarricq et al. 2022). We also fitted the CMDs of 13 candidate CBOCs using the PARSEC 1.2s isochrones and the code powerful CMD to determine the fundamental parameters such as distance modulus, metallic-ity, colour excess, and age. The masses of these clusters were also estimated by comparing the CMDs of star clusters and theoretical stellar populations with different IMF slopes. The Roche radii were then calculated based on the distances between the sub-clusters and their masses.
We found that seven candidate CBOCs in Table 4 (without CWNU2666 and HSC224 and HSC189 and UPK224) formed simultaneously, that is, they are PBOCs, because the two subclusters of such a binary cluster have similar stellar distributions, stellar proper motion distributions, stellar radial velocity distributions, metallicities, ages, and reddenings. For the other two pairs, that is, CWNU2666 and HSC224 and HSC189 and UPK224, the sub-cluster ages are either too old or too different for a binary cluster system to remain stable over such a long period. This suggests that these two pairs might have formed through tidal capture. The list of candidate binary clusters will be useful for numerous detailed studies, for instance for an investigation of the interactions between sub-clusters of binary star clusters or clusters with higher multiplicities.
In addition, following the method of Minniti et al. (2004), we calculated the orbital periods and velocities of cluster pairs because the orbital velocities represent the maximum difference in radial velocities of cluster pairs. The large errors in the radial velocities provided by Gaia prevented us from determining whether a pair was a binary cluster based on orbital velocities alone, however. Regardless of the value of the orbital velocities, ∆RV can always be smaller than the orbital velocity because the error in the radial velocity is large. Radial velocity observations with a greater precision are therefore essential for confirming binary clusters.
We compared the kinetic and potential energies of OCs to distinguish between bound clusters and unbound moving groups. Four pairs of candidate binary clusters were finally excluded from bound clusters because at least one object in such a pair is an unbound system. The results depend on the method used for the study, however. Hunt & Reffert (2024) calculated the size of the Roche surface of clusters (their Jacobi radius) to differentiate between bound and unbound clusters. We confirmed our classification results with Hunt & Reffert (2024) regarding these 13 pairs of clusters. Hunt & Reffert (2024) classified most of these clusters as unbound systems and retained only three candidate CBOCs (BDSB 93 and HSC 1740, CWNU 2666 and HSC 224, and HSC 2204 and OC 0508). The classification of the cluster pair HSC 2204 and OC 0508 differs between this work and Hunt & Reffert (2024). The results of this work therefore require further investigations.
We only studied the candidate CBOCs in the Milky Way. Many more wide binary open clusters (WBOCs) are expected, however. We will study them in another work. This will be important for understanding the properties, formation, and evolution of binary star clusters.
Since our research is based on the catalogue of Hunt & Reffert (2023), the results depend on the accuracy of the data in the catalogue. There are usually some uncertainties in such catalogue. Another catalogue contains many more star clusters, that is UCC (Perren et al. 2023). Many clusters are duplicates, however. This prevents us from using the database directly to search for binary clusters. It is necessary to carry out further studies after the database has been processed.
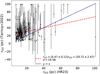 |
Fig. 6 Comparison of tidal radii obtained by HR23 (rt23) and Tarricq et al. (2022) (rt22) for 202 clusters. The tidal radius errors are taken from Tarricq et al. (2022). The blue line shows the isoline, and the red line shows a linear fit to the correlation. |
Data availability
The data can be derived from Zenodo (https://doi.org/10.5281/zenodo.12703204)
Acknowledgements
This work has been supported by the National Natural Science Foundation of China (No. 12473029) Dali Expert Workstation of Rainer Spurzem, Yunnan Academician Workstation of Wang Jingxiu (202005AF150025), China Manned Space Project (No. CMS-CSST-2021-A08), and Guanghe Fundation (No. ghfund202407013470). This work has made use of data from the European Space Agency (ESA) mission Gaia (https://www.cosmos.esa.int/gaia), processed by the Gaia Data Processing and Analysis Consortium (DPAC, https://www.cosmos.esa.int/web/gaia/dpac/consortium). Funding for the DPAC has been provided by national institutions, in particular the institutions participating in the Gaia Multilateral Agreement.
Appendix A Comparison of cluster parameters with recent literatures
In the appendix, we compare the stellar ages and masses that are derived from isochrone fit in this work and the results of some recent literatures (Hunt & Reffert 2024; Almeida et al. 2023; Cavallo et al. 2024). This work estimates the total cluster mass including some stars that were not observed, e.g. very faint stars, and the initial mass is given, for each cluster. Meanwhile, most other works counted the current masses of the observed stars. In addition, different methods including isochrone fits, Monte Carlo method, and artificial neural network were used by these works. We see that the stellar ages from different works are usually different, and the masses from this work are significantly larger than other works for most clusters. However, it is reasonable because there should be much more low mass stars if the members of a cluster obey a exponential-like IMF.
Cluster parameters from this work and some recent literatures.
References
- Allen, C., Ruelas-Mayorga, A., Sánchez, L. J., et al. 2018, MNRAS, 481, 3953 [NASA ADS] [Google Scholar]
- Almeida, A., Monteiro, H., & Dias, W. S. 2023, MNRAS, 525, 2315 [NASA ADS] [CrossRef] [Google Scholar]
- Anders, F., Castro-Ginard, A., Casado, J., Jordi, C., & Balaguer-Núñez, L. 2022, Res. Notes Am. Astron. Soc., 6, 58 [Google Scholar]
- Bekki, K., Beasley, M. A., Forbes, D. A., & Couch, W. J. 2004, ApJ, 602, 730 [NASA ADS] [CrossRef] [Google Scholar]
- Bhatia, R. K., & Hatzidimitriou, D. 1988, MNRAS, 230, 215 [NASA ADS] [Google Scholar]
- Binney, J., & Tremaine, S. 2008, Galactic Dynamics, 2nd edn. (Princeton: Princeton University Press) [Google Scholar]
- Bressan, A., Marigo, P., Girardi, L., et al. 2012, MNRAS, 427, 127 [NASA ADS] [CrossRef] [Google Scholar]
- Brown, J. H., Burkert, A., & Truran, J. W. 1995, ApJ, 440, 666 [NASA ADS] [CrossRef] [Google Scholar]
- Camargo, D. 2021, ApJ, 923, 21 [NASA ADS] [CrossRef] [Google Scholar]
- Camargo, D., Bica, E., & Bonatto, C. 2016, MNRAS, 455, 3126 [Google Scholar]
- Cantat-Gaudin, T., & Anders, F. 2020, A&A, 633, A99 [NASA ADS] [CrossRef] [EDP Sciences] [Google Scholar]
- Cantat-Gaudin, T., Anders, F., Castro-Ginard, A., et al. 2020, A&A, 640, A1 [NASA ADS] [CrossRef] [EDP Sciences] [Google Scholar]
- Casagrande, L., & VandenBerg, D. A. 2018, MNRAS, 479, L102 [NASA ADS] [CrossRef] [Google Scholar]
- Cavallo, L., Spina, L., Carraro, G., et al. 2024, AJ, 167, 12 [NASA ADS] [CrossRef] [Google Scholar]
- Conrad, C., Scholz, R. D., Kharchenko, N. V., et al. 2017, A&A, 600, A106 [NASA ADS] [CrossRef] [EDP Sciences] [Google Scholar]
- de La Fuente Marcos, R., & de La Fuente Marcos, C. 2009, A&A, 500, L13 [NASA ADS] [CrossRef] [EDP Sciences] [Google Scholar]
- de la Fuente Marcos, R., & de la Fuente Marcos, C. 2010, ApJ, 719, 104 [CrossRef] [Google Scholar]
- Deng, Y.-Y., & Li, Z.-M. 2024, Res. Astron. Astrophys., 24, 065004 [Google Scholar]
- De Silva, G. M., Carraro, G., D’Orazi, V., et al. 2015, MNRAS, 453, 106 [Google Scholar]
- Dias, W. S., Alessi, B. S., Moitinho, A., & Lépine, J. R. D. 2002, A&A, 389, 871 [NASA ADS] [CrossRef] [EDP Sciences] [Google Scholar]
- Dias, W. S., Monteiro, H., Moitinho, A., et al. 2021, MNRAS, 504, 356 [NASA ADS] [CrossRef] [Google Scholar]
- Dieball, A., Müller, H., & Grebel, E. K. 2002, A&A, 391, 547 [NASA ADS] [CrossRef] [EDP Sciences] [Google Scholar]
- Fujimoto, M., & Kumai, Y. 1997, AJ, 113, 249 [NASA ADS] [CrossRef] [Google Scholar]
- Gaia Collaboration (Brown, A. G. A., et al.) 2021, A&A, 649, A1 [NASA ADS] [CrossRef] [EDP Sciences] [Google Scholar]
- Gaia Collaboration (Drimmel, R., et al.) 2023a, A&A, 674, A37 [CrossRef] [EDP Sciences] [Google Scholar]
- Gaia Collaboration (Vallenari, A., et al.) 2023b, A&A, 674, A1 [NASA ADS] [CrossRef] [EDP Sciences] [Google Scholar]
- Hatzidimitriou, D., & Bhatia, R. K. 1990, A&A, 230, 11 [NASA ADS] [Google Scholar]
- He, Z., Wang, K., Luo, Y., et al. 2022, ApJS, 262, 7 [NASA ADS] [CrossRef] [Google Scholar]
- He, Z., Liu, X., Luo, Y., et al. 2023, ApJS, 264, 8 [NASA ADS] [CrossRef] [Google Scholar]
- Hunt, E. L., & Reffert, S. 2023, A&A, 673, A114 [NASA ADS] [CrossRef] [EDP Sciences] [Google Scholar]
- Hunt, E. L., & Reffert, S. 2024, A&A, 686, A42 [NASA ADS] [CrossRef] [EDP Sciences] [Google Scholar]
- King, I. 1962, AJ, 67, 471 [Google Scholar]
- Kroupa, P. 2001, MNRAS, 322, 231 [NASA ADS] [CrossRef] [Google Scholar]
- Kuhn, M. A., Hillenbrand, L. A., Sills, A., et al. 2019, ApJ, 870, 32 [Google Scholar]
- Li, Z.-M., & Mao, C.-Y. 2024, Res. Astron. Astrophys., 24, 055014 [Google Scholar]
- Li, Z.-M., Mao, C.-Y., Luo, Q.-P., et al. 2017, Res. Astron. Astrophys., 17, 071 [Google Scholar]
- Loktin, A. V. 1997, Astron. Astrophys. Trans., 14, 181 [CrossRef] [Google Scholar]
- Loktin, A. V., & Popova, M. E. 2017, Astrophys. Bull., 72, 257 [NASA ADS] [CrossRef] [Google Scholar]
- Lynga, G. 1995, VizieR Online Data Catalogue: VII/92A [Google Scholar]
- McNamara, B. J., & Sanders, W. L. 1983, A&A, 118, 361 [NASA ADS] [Google Scholar]
- Mermilliod, J. C., & Paunzen, E. 2003, A&A, 410, 511 [NASA ADS] [CrossRef] [EDP Sciences] [Google Scholar]
- Minniti, D., Rejkuba, M., Funes, J. G., et al. 2004, ApJ, 612, 215 [Google Scholar]
- Perren, G. I., Pera, M. S., Navone, H. D., et al. 2023, MNRAS, 526, 4107 [NASA ADS] [CrossRef] [Google Scholar]
- Piecka, M., & Paunzen, E. 2021, A&A, 649, A54 [NASA ADS] [CrossRef] [EDP Sciences] [Google Scholar]
- Piskunov, A. E., Kharchenko, N. V., Schilbach, E., et al. 2008, A&A, 487, 557 [NASA ADS] [CrossRef] [EDP Sciences] [Google Scholar]
- Portegies Zwart, S. F., & Rusli, S. P. 2007, MNRAS, 374, 931 [Google Scholar]
- Portegies Zwart, S. F., McMillan, S. L. W., & Gieles, M. 2010, ARA&A, 48, 431 [NASA ADS] [CrossRef] [Google Scholar]
- Priyatikanto, R., Kouwenhoven, M. B. N., Arifyanto, M. I., et al. 2016, MNRAS, 457, 1339 [NASA ADS] [CrossRef] [Google Scholar]
- Qin, S., Zhong, J., Tang, T., et al. 2023, ApJS, 265, 12 [NASA ADS] [CrossRef] [Google Scholar]
- Skrutskie, M. F., Cutri, R. M., Stiening, R. C., et al. (2006), AJ, 131, 1163 [NASA ADS] [CrossRef] [Google Scholar]
- Song, F., Esamdin, A., Hu, Q., & Zhang, M. 2022, A&A, 666, A75 [NASA ADS] [CrossRef] [EDP Sciences] [Google Scholar]
- Subramaniam, A., Gorti, U., Sagar, R., & Bhatt, H. C. 1995, A&A, 302, 86 [NASA ADS] [Google Scholar]
- Tarricq, Y., Soubiran, C., Casamiquela, L., et al. 2022, A&A, 659, A59 [NASA ADS] [CrossRef] [EDP Sciences] [Google Scholar]
- Weisz, D. R., Johnson, L. C., Foreman-Mackey, D., et al. 2015, ApJ, 806, 198 [NASA ADS] [CrossRef] [Google Scholar]
All Tables
Fundamental parameters and astrometric information for the 13 newly discovered candidate CBOCs.
One-dimensional velocity dispersions (σ1D) and velocity dispersions needed for the virial equilibrium (σvir10 and σvir5) of the 26 cluster candidates.
All Figures
|
Fig. 1 CBOC assessment. Two clusters with d12 ≤ r1 + r2 are considered a close pair. d12 is the distance between two cluster centres. r1 and r2 are the tidal radii of two clusters. |
| In the text | |
|
Fig. 2 Proper motion similarity assessment. Two clusters with Dpm < max(σ1pm,σ2pm) are thought to have common proper motion. Dpm is the distance between the proper motion centres of two clusters. σ1pm and σ2pm are the σ values of two clusters. |
| In the text | |
|
Fig. 3 Classification of all cluster pairs. The orange dots indicate pairs whose member clusters may belong to the same cluster. The blue dots indicate pairs whose separations are smaller than the sum of the tidal radii of member clusters and whose proper motions differ clearly. The green points denote cluster aggregates. The red triangles indicate CBOC candidates. |
| In the text | |
|
Fig. 5 Distributions of PMs, CMDs, parallaxes, and celestial position of member stars of nine newly found candidate CBOCs. In the panels except for the CMD, black and red show the two sub-clusters. In the CMD panel, blue and red and crosses and points show the observed stars and best-fit isochrones. The error bars show the median uncertainties (from the Gaia report) in proper motion, magnitudes, and parallax at 20 mag and in the coordinates (from all member stars of a cluster). |
| In the text | |
|
Fig. 5 Distribution of cluster pairs in the space of age difference vs. ratio of Rroche to the tidal radius for each cluster. The sub-clusters of a pair are shown in the same colour and shapes. When two sub-clusters of a pair differ in age by less than 50 Myr (horizontal dotted black line) and the ratio of Rroche to tidal radius of each sub-cluster is lower than 1 (vertical dotted black line), it is considered a PBOC. |
| In the text | |
|
Fig. 6 Comparison of tidal radii obtained by HR23 (rt23) and Tarricq et al. (2022) (rt22) for 202 clusters. The tidal radius errors are taken from Tarricq et al. (2022). The blue line shows the isoline, and the red line shows a linear fit to the correlation. |
| In the text | |
Current usage metrics show cumulative count of Article Views (full-text article views including HTML views, PDF and ePub downloads, according to the available data) and Abstracts Views on Vision4Press platform.
Data correspond to usage on the plateform after 2015. The current usage metrics is available 48-96 hours after online publication and is updated daily on week days.
Initial download of the metrics may take a while.