Fig. 1.
Download original image
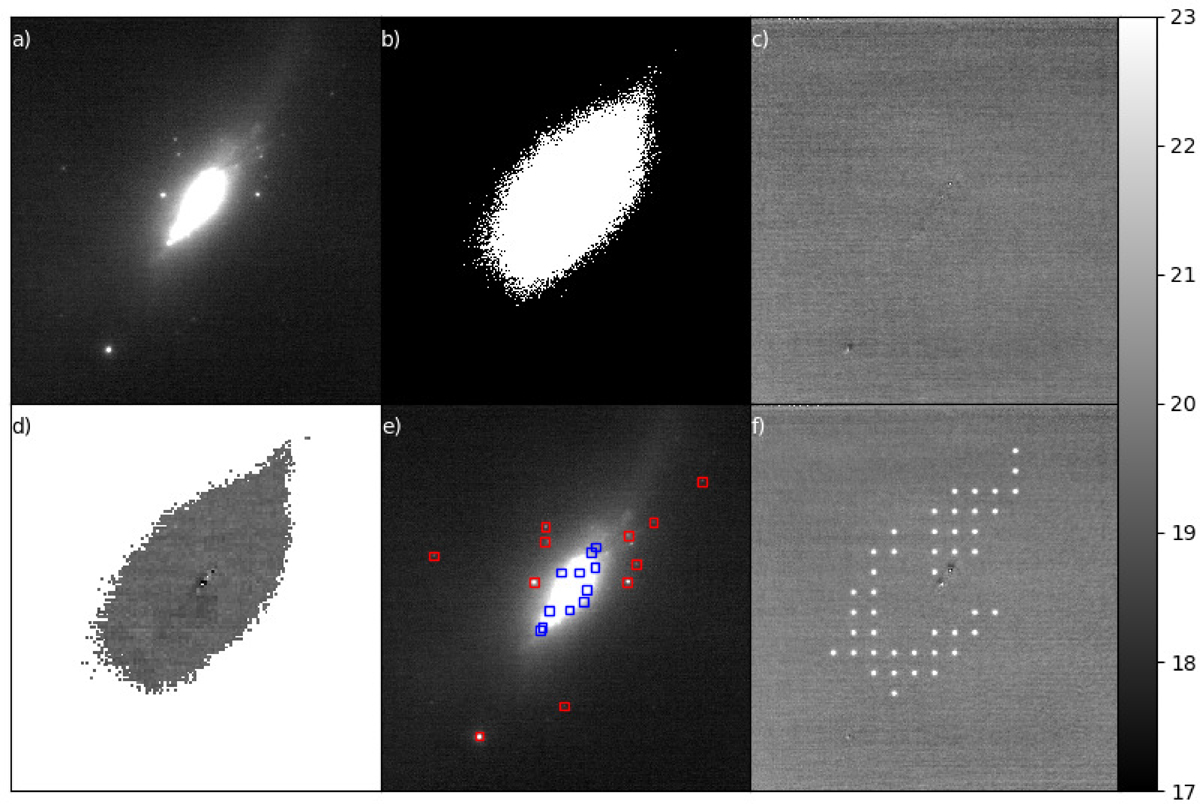
Galaxy IC 883 in different stages of determining the limiting magnitudes. (a) 22″ × 22″ median stacked image of the sample galaxy IC 883. (b) Galaxy map constructed from the median stacked image. (c) Example of a template subtraction. (d) Limiting magnitudes of IC 883 with the scale on the right. The two white pixels in the centre of the galaxy represent areas where persistent template subtraction artefacts prevented analysis; further details are provided in Sect. 3.2. (e) Example stamp positions for four sets of stamp lists. The red squares denote the non-varied stamps in the stamp lists and the blue squares denote the varied stamp. The positions of both sets was changed in a subsequent run to ensure that the whole galaxy was covered. (f) Example of the limiting magnitude iteration process. Visible point sources are simulated SNe at 16.8 mag, which are positioned on the galaxy map, excluding the stamp areas, separated by 7 × FWHM = 42 pixels.
Current usage metrics show cumulative count of Article Views (full-text article views including HTML views, PDF and ePub downloads, according to the available data) and Abstracts Views on Vision4Press platform.
Data correspond to usage on the plateform after 2015. The current usage metrics is available 48-96 hours after online publication and is updated daily on week days.
Initial download of the metrics may take a while.