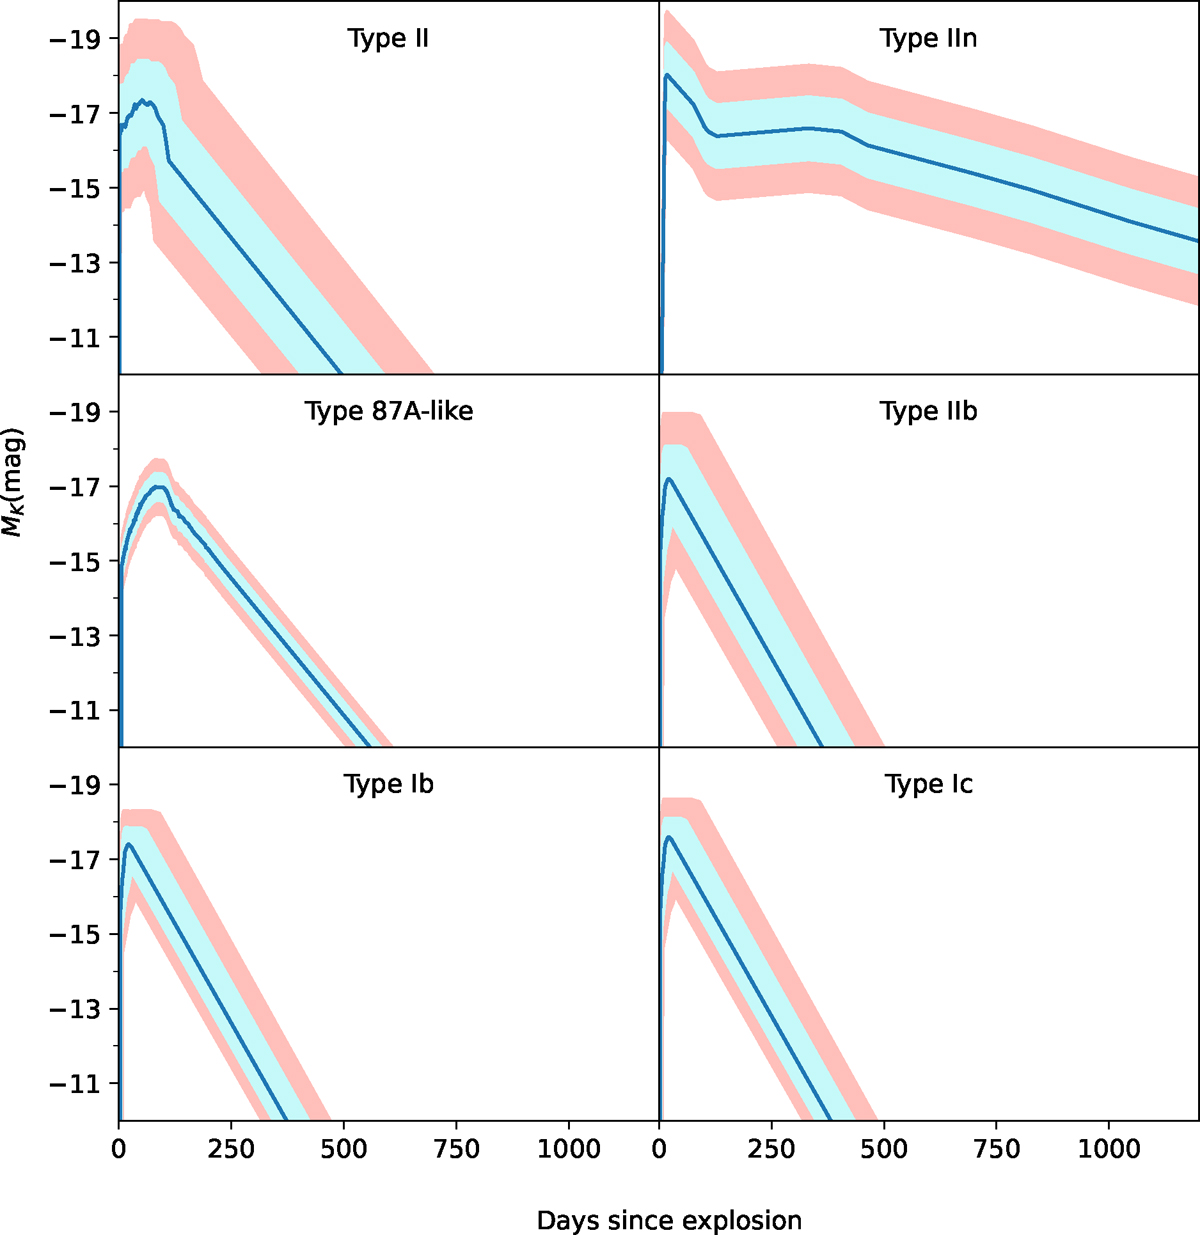
Fig. 2.
Download original image
Possible ranges of the K-band template light curves. The dark blue line is the median value and the light blue and red areas are the ranges within 1σ and 2σ, respectively. All parameters follow a Gaussian distribution, except for the H-poor templates. Their fastest possible evolution is limited to match the fastest SN in our template sample to avoid unrealistically rapid evolution. All templates are extrapolated with a linear tail phase.
Current usage metrics show cumulative count of Article Views (full-text article views including HTML views, PDF and ePub downloads, according to the available data) and Abstracts Views on Vision4Press platform.
Data correspond to usage on the plateform after 2015. The current usage metrics is available 48-96 hours after online publication and is updated daily on week days.
Initial download of the metrics may take a while.