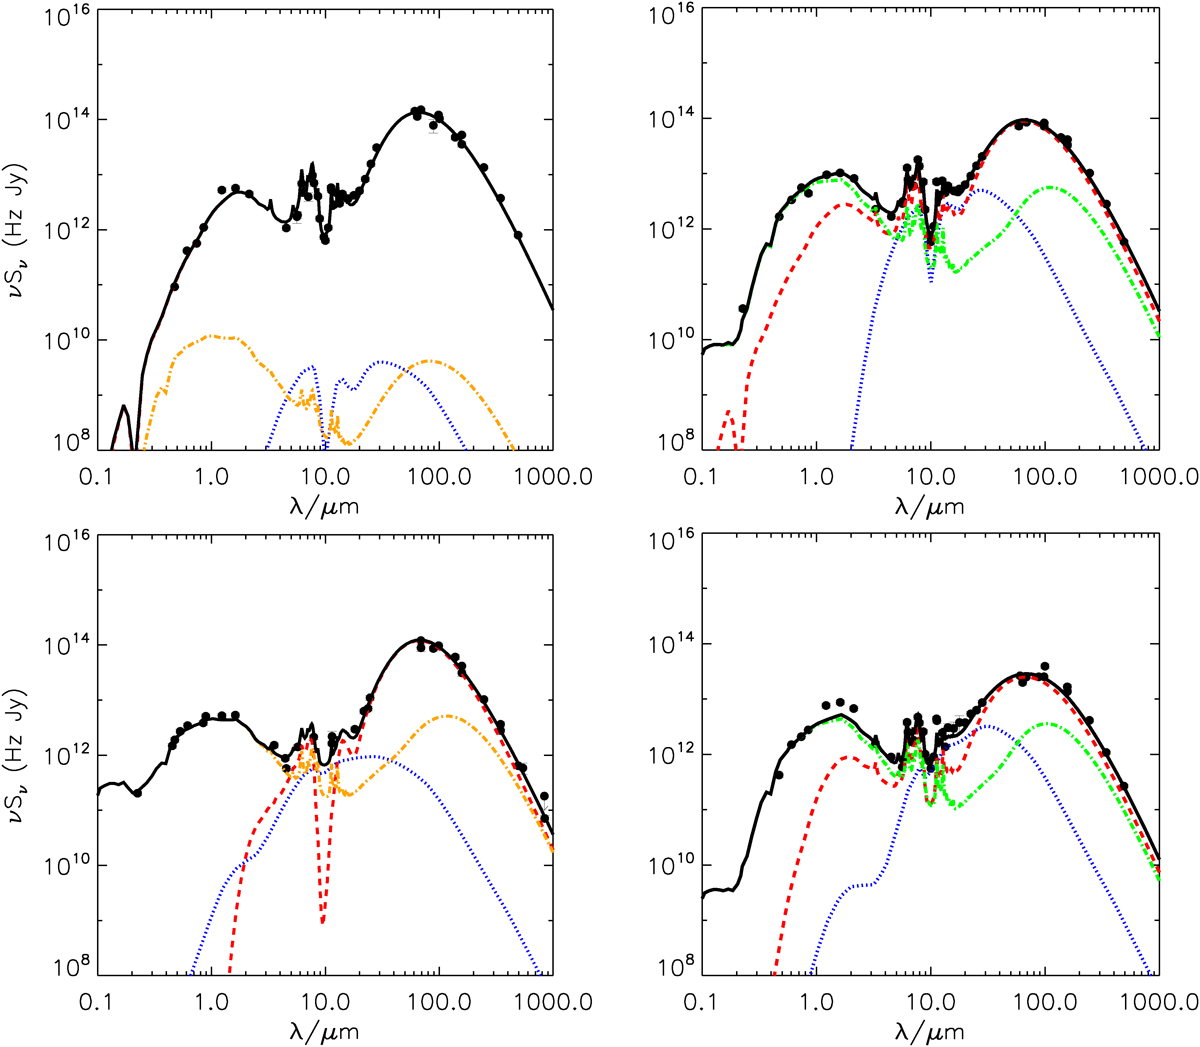
Fig. 4.
Download original image
Our SED models (solid black curves) for the observations (black points) of four sample LIRGs, including IRAS 17578−0400 (top left), MCG+08-11-002 (top right), CGCG 049−057 (bottom left), and IRAS 16516−0948 (bottom right). The model components include a spheroidal (dot dashed orange) or a disc (dot dashed green), starburst contribution (dashed red), and an AGN (dotted blue). We note that the starburst component of IRAS 17578−0400 dominates the total emission and is overlapped by the combined model curve, due to the small contribution of the other components.
Current usage metrics show cumulative count of Article Views (full-text article views including HTML views, PDF and ePub downloads, according to the available data) and Abstracts Views on Vision4Press platform.
Data correspond to usage on the plateform after 2015. The current usage metrics is available 48-96 hours after online publication and is updated daily on week days.
Initial download of the metrics may take a while.