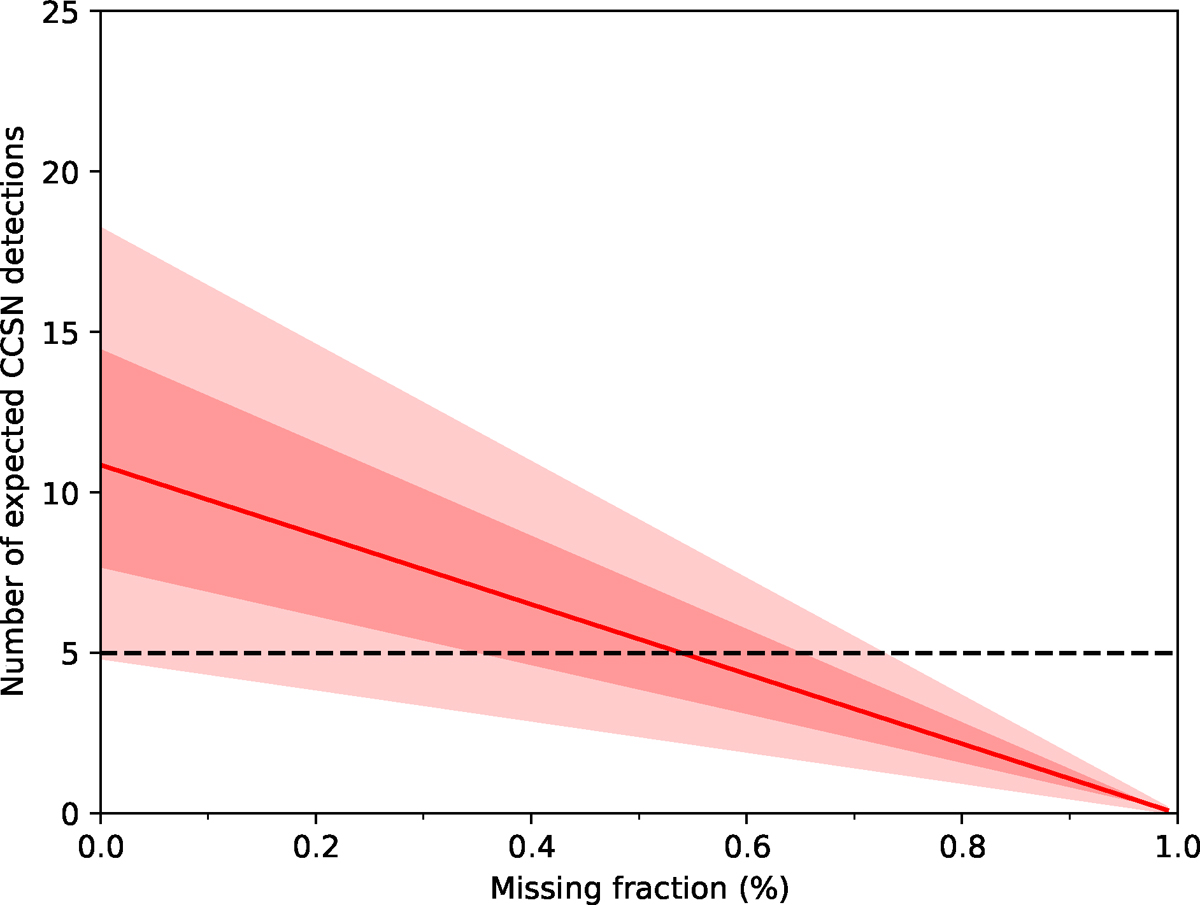
Fig. 5.
Download original image
Number of expected CCSNe detections from the Monte Carlo simulation compared to the missing fraction. Red line: Total number of expected CCSN detections from the dataset over the survey period as a function of the missing fraction. Shaded red areas: 1σ and 2σ confidence areas for the total number of expected CCSN detections from the dataset over the survey period as a function of the missing fraction. Poissonian upper and lower limits due to small number statistics and the cumulative effect of other error sources are combined here. Dashed black: Number of real detected CCSNe in the survey.
Current usage metrics show cumulative count of Article Views (full-text article views including HTML views, PDF and ePub downloads, according to the available data) and Abstracts Views on Vision4Press platform.
Data correspond to usage on the plateform after 2015. The current usage metrics is available 48-96 hours after online publication and is updated daily on week days.
Initial download of the metrics may take a while.