Fig. 1
Download original image
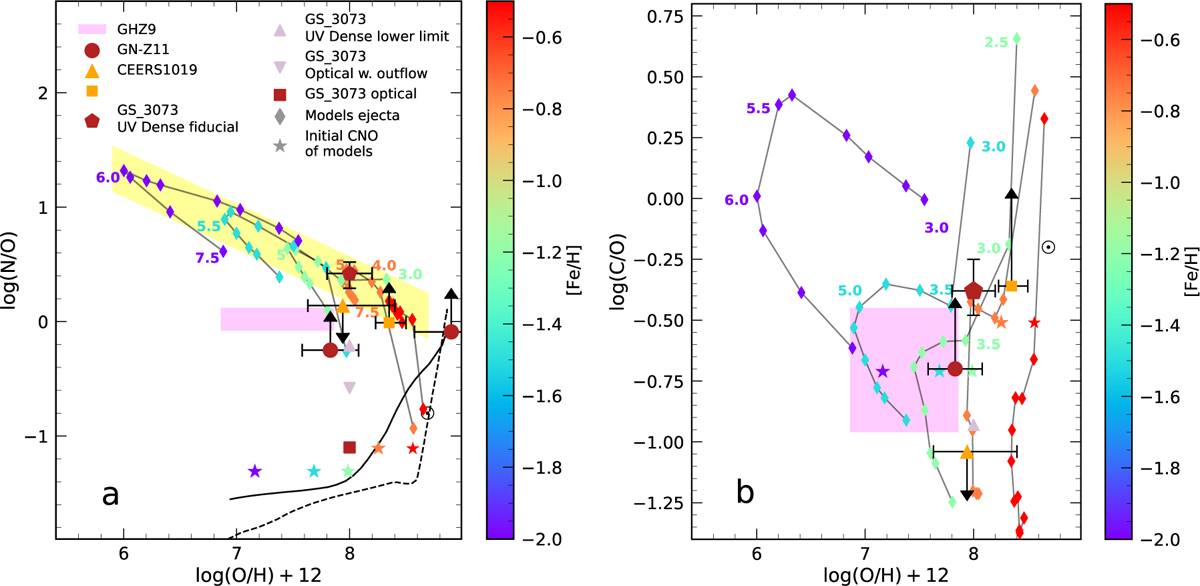
Abundances in GN-z11, GHz9, CEERS 1019, and GS_3073 compared with models. Panel a: diagram log(N/O) vs. log(O/H)+12. For GN-z11 and CEERS 1019, we show the standard locations in the literature and the locations based on models by Isobe et al. (2023) including the AGN radiation (see Table 1); for GS_3073 we show the fiducial (red pentagon) and lower limit (grey triangle) derived from the UV-dense lines, monitoring the region closest to the AGN, while the log(N/O) from optical lines are the red square (without outflow) and the reverse grey triangle (with outflow). The colour scale on the right defines the metallicity of the different sets of mass-averaged ejecta composition (triangles) for initial AGB masses from 7.5 to 3 M⊙- or 2.5 M⊙ in one case from the models by Ventura et al. (2013). The metal mass fractions of the tracks Z and the corresponding [Fe/H] are Z=0.0003 ([Fe/H]=–2), 0.001 (–1.5), 0.002 (–1.2), 0.004 (–0.75), and 0.008 (–0.45). A few masses are also labelled as reference. The yellow band shows the reference location of ejecta dominated by hot bottom burning as a function of log(O/H). Stars represent the initial O/H and N/O abundances of the models. The solar symbol is placed at the values corresponding to solar abundances. At the bottom we show the upper (full line) and lower (dashed line) envelope of the chemical evolution models by Vincenzo et al. (2016). Panel b: diagram log(C/O) vs. log(O/H)+12. The symbols and lines are the same as in panel a.
Current usage metrics show cumulative count of Article Views (full-text article views including HTML views, PDF and ePub downloads, according to the available data) and Abstracts Views on Vision4Press platform.
Data correspond to usage on the plateform after 2015. The current usage metrics is available 48-96 hours after online publication and is updated daily on week days.
Initial download of the metrics may take a while.