| Issue |
A&A
Volume 700, August 2025
|
|
|---|---|---|
| Article Number | A265 | |
| Number of page(s) | 12 | |
| Section | Galactic structure, stellar clusters and populations | |
| DOI | https://doi.org/10.1051/0004-6361/202554957 | |
| Published online | 26 August 2025 | |
Dating N-loud AGNs at high redshift
GS_3073 as a snapshot of a ω Centauri-like evolution of a nuclear star cluster
1
Istituto Nazionale di Astrofisica, Osservatorio Astronomico di Roma,
Via Frascati 33,
00078
Monte Porzio Catone,
Italy
2
Istituto Nazionale di Astrofisica – Osservatorio Astronomico di Padova,
Vicolo dell’Osservatorio 5,
Padova
35122,
Italy
3
Dipartimento di Fisica e Astronomia “Galileo Galilei”, Univ. di Padova,
Vicolo dell’Osservatorio 3,
Padova
35122,
Italy
4
Department of Astronomy, Indiana University,
Swain West, 727 E. 3rd Street,
Bloomington,
IN
47405,
USA
5
Dipartimento di Fisica e Astronomia Augusto Righi, Università degli Studi di Bologna,
Via Gobetti 93/2,
40129
Bologna,
Italy
6
INAF – OAS, Osservatorio di Astrofisica e Scienza dello Spazio di Bologna,
via Gobetti 93/3,
40129
Bologna,
Italy
7
Istituto Nazionale di Astrofisica – Istituto di Astrofisica e Planetologia Spaziali,
Via Fosso del Cavaliere 100,
00133
Roma,
Italy
★ Corresponding author.
Received:
1
April
2025
Accepted:
8
July
2025
Abstract
We address two major questions raised by recent observations of the young Universe made with the James Webb Space Telescope. These questions are first, the amount of the seed initial masses, and the speed of growth of supermassive black holes (BHs) with masses of 106–108 M⊙ in active galactic nuclei (AGN) that are hosted by very young galaxies. The second question is an explanation for the supersolar abundances of nitrogen in a fraction of young galaxies at high redshift, with and without evidence of a massive central black hole. While the redshift in the still-forming high-redshift galaxies with AGN is an upper limit to the ages of the seed black holes, any independent age determination provides a more stringent constraint on the BH accretion modalities and on the initial seed mass. We mainly focused on the system GS_3073. This system shows an exceptionally high log(N/O)=+0.42−0.10+0.13 in the gas close to the AGN. We show here that this abundance is consistent with the composition of gas ejected from massive asymptotic giant branch stars. Moreover, the chemical properties of this system match those expected at a specific point in the evolution of the abundances in the extreme populations of the former nuclear star cluster ω Centauri (ωCen). This analogy, along with the N/O, C/O, and Fe/O abundances in GS_3073, lead to an estimate of an age range of 270–440 Myr for this object, which is much younger than the redshift (z=5.5) age of ∼1 Gyr. We also adopted the same criteria to estimate an age for GN-z11. These two determinations constrain the BH mass versus age relation: Accretion onto the BH must proceed at intermittent super-Eddington rates in the first phases and at a much lower rate after the first half gigayear of life of the Universe. The intermittency of accretion is also a fundamental requirement to allow the formation of the extreme (N-rich, O-depleted, He-rich) populations that are observed today in ω Cen for a wide range of metallicities.
Key words: stars: abundances / stars: AGB and post-AGB / stars: black holes / galaxies: high-redshift / quasars: supermassive black holes / galaxies: star clusters: general
© The Authors 2025
 Open Access article, published by EDP Sciences, under the terms of the Creative Commons Attribution License (https://creativecommons.org/licenses/by/4.0), which permits unrestricted use, distribution, and reproduction in any medium, provided the original work is properly cited.
This article is published in open access under the Subscribe to Open model. This email address is being protected from spambots. You need JavaScript enabled to view it. to support open access publication.
1 Introduction
Supermassive black holes (SMBH) of ∼109 M⊙ are present in-high redshift (z∼6–7) quasars (e.g. Fan et al. 2023, and references therein). This raises the question of the formation of such massive objects within less than a billion years from the Big Bang. Initial seed black holes (BHs) are expected to have low masses (masses up to few 100 M⊙) or high masses (>104 M⊙). Massive seeds may be born as a result of a channel in which the BH collapsed directly (DCBH), which is the collapse of metal free gas clouds at z≥10 (Loeb & Rasio 1994; Bromm & Loeb 2003; Lodato & Natarajan 2006), while light seeds may be remnants of primordial stars (population III, Pop. III), which are expected to produce BHs with a mass of M>250 M⊙ because their Jeans mass is high and the wind mass-loss efficiency is low (e.g. Madau & Rees 2001). Alternatively, they might be the product of a dynamical merging of stellar mass BHs in crowded stellar environments (e.g. Portegies Zwart & McMillan 2002; Giersz et al. 2015). Runaway collisions in extremely compact clusters may also produce very massive or supermassive stars that later collapse into seed BHs with even >103 M⊙ (Fujii et al. 2024; Lahén et al. 2025). Even if light BH seeds were subject to steady Eddington-limited accretion from early times, they cannot grow up to ∼109 M⊙ or more at z≥6. It is therefore necessary to resort to either heavy seeds or to phases of super-Eddington accretion (see Volonteri et al. 2021, for a review). Disentangling the possible origins and masses of seed BHs requires information on the intermediate steps of the accretion process by examining BHs at higher redshift (e.g. Ferrara et al. 2014; Inayoshi et al. 2020). This has been made possible today by the James Webb Space Telescope (JWST), whose recent observations that extended to much younger ages detected an unexpectedly large number of both broad- and narrow-line AGNs (e.g. Harikane et al. 2023; Maiolino et al. 2024a; Chisholm et al. 2024). The properties of the BHs hosted by these AGN, and especially those at z>10 and ages of the Universe <460 Myr, may provide key insights into the BH seeds and the origin of SMBHs.
A small number of high-z young star-forming galaxies have been found to be rich in nitrogen, with supersolar N/O ratios (Cameron et al. 2023; Marques-Chaves et al. 2024). All of them are compact, and their interstellar medium densities and star formation rates are high (Schaerer et al. 2024). The high N abundance is not seen at similar metallicities in the nearby Universe (e.g. Izotov et al. 2012, 2023), nor is it predicted by standard chemical evolution models (e.g. Vincenzo et al. 2016). In a few of these young galaxies, an AGN was revealed through the study of the diagnostic lines, which means that these objects apparently correspond to the N-loud AGN. These constitute a small percentage of the entire AGN sample at all redshifts. Interestingly, Isobe et al. (2025) found that about a half of the high-z N-rich galaxies have AGN signatures, while probably only a minority of the young non-AGN galaxies are N-rich. Thus, N-loudeness appears to be a peculiar feature of systems in an early stage of the growth of their central BH. This apparently implies that the high-N signature is a rare event in the life of a young star-forming galaxy, but it may be a much more common event in the life of young AGNs.
For all the systems whose spectral analysis indicates a high star formation rate and the presence of massive short-lived stars, the high N/O may result from a variety of mass-loss events in which CNO-cycled material is expelled, such as some stages of the massive Wolf–Rayet stars (Limongi & Chieffi 2018; Kobayashi & Ferrara 2024), a common envelope, or other forms of strong mass loss in the non-conservative evolution of interacting binaries (Renzini 2023), mass loss from rapidly rotating massive stars (Decressin et al. 2007), very massive stars (100– 1000 M⊙, Vink 2023), or even supermassive (>103−104M⊙) stars (Charbonnel et al. 2023; Nagele & Umeda 2023). An alternative interpretation of anomalous high N or C content by Rossi et al. (2024) is that this is due to enrichment from faint Pop. III supernovae, a result obtained by incorporating stochastic chemical enrichment from primordial stars into a chemical evolution model calibrated on the galactic data.
Most of these explanations may be suitable for describing the current status of the gas in these galaxies, for instance in the very young Sunburst galaxy (Pascale et al. 2023). The main constraint on these models is that a very short phase is observed (one to a few million years). The necessity of reconciling the oxygen abundance with the high nitrogen may also require more than one burst of star formation (Kobayashi & Ferrara 2024). The scarce number of young star-forming galaxies with high N/O is consistent with the short-lived phases of N-rich gas.
An anomalous prototype among high-z N-rich galaxies is GN-z11 at redshift z=10.6 as measured from JWST/NIRSpec (Bunker et al. 2023). Its intrinsic half-light radius is only 0.016±0.005" (64±20pc) in the JADES NIRCam imaging (Tacchella et al. 2023). These features suggested that GN-z11 and the other systems with high N/O host a possible globular cluster (GC) in formation (Senchyna et al. 2024; Belokurov & Kravtsov 2023). The high [N/O] can be consistent with the abundances measured in the second-generation stars of GC stars, which induced several groups (e.g. Charbonnel et al. 2023; Renzini 2023; Marques-Chaves et al. 2024; D’Antona et al. 2023) to propose that this might be the second stage of star formation that apparently occurred in all galactic GCs (see Gratton et al. 2019; Milone & Marino 2022, for recent reviews). A high N/O is just one of the many signatures of GC multiple populations. The stellar spectra of GCs show many other more peculiar abundance anti-correlations of light elements, which testifies that the gas that formed second-generation stars has been processed by proton-capture reactions at high temperature (T>40 MK). This left the signatures of full CNO processing and of the Ne–Na and Mg–Al chains (e.g. Gratton et al. 2019).
In the case of GN-z11, D’Antona et al. (2023) reported that the population synthesis necessary to model the spectrum required a very high star formation rate and a very young age, but this requirement was dramatically dependent on having neglected the contribution to the spectral energy distribution of a central accreting massive BH (D’Silva et al. 2023), as revealed by the analysis of AGN-type characteristic features of the spectrum (Maiolino et al. 2024b). When the constraint on the age and star formation is relaxed, the high N/O may result from the flow towards the centre of gravity (including the central BH) of low-velocity winds from massive asymptotic giant branch (AGB) stars, which are at the basis of the AGB model for the formation of multiple GC populations (e.g. D’Ercole et al. 2008).
If a central very massive GC is present at the point source of GN-z11, and if GN-z11 contains a massive BH, like the nuclear star clusters (NSCs), which generally host the SMBHs of most galaxies in the local Universe, the NSC might play a key role in explaining the anomalous N/O and the formation of the seed of the central BH. The hypothesis that an initial NSC that further acquires mass by merging with other clusters and/or by massive gas accretion from the surrounding medium is present may simultaneously explain the formation and growth of a central BH and account for conspicuous winds of massive AGB stars, which are N-rich for a long lifetime (~100Myr, to be compared with the few million years of the N-rich winds of young massive or supermassive stars). Therefore these winds would be better consistent with the high percentage of N-loud young AGNs (Isobe et al. 2025).
Scaling of the AGN properties to the case of GN-z11 provides a mass of ~1.6 × 10⁶ M⊙ for this object, and its luminosity (LAGN) currently appears to be higher than the Eddington luminosity (LE), (LAGN = 2-5 × LE). This raises the question of the seed initial mass and its growth (Maiolino et al. 2024b). The possible ages of the system that are compatible with AGB N/O-rich ejecta are ~70-130 Myr, but the short age, 70 Myr, requires an accretion rate that is five times higher than the Eddington rate, while the latter age is compatible with the lower limit of twice the Eddington rate (D’Antona et al. 2023). These values must be sustained continuously for the whole period of time. In the model by D’Antona et al. (2023), these phases of fast accretion occur on a seed that might have grown to mass of 100-1000 M⊙ through stellar mergers in the core of the NSC, when accretion of the stellar AGB winds and of the gas surrounding the object becomes important.
These accretion-rate values are huge, even if the BH may sustain supercritical accretion flows in the framework of the slim-disk solution (Abramowicz & Lasota 1995). Most attempts to follow the evolution history of the accreting BH (see, e.g. Schneider et al. 2023; Trinca et al. 2023, 2024) reported a highly variable modulation of the accretion rate. Madau et al. (2014) reported examples of evolution histories with three main accretion episodes at rates of three times the Eddington rate that lasted 50 Myr and were followed by quiescent periods of 100 Myr. Volonteri et al. (2015) estimated the duty cycles of intermittent phases of super-Eddington growth, coupled with star formation via positive feedback, which may account for the early growth of SMBH and the coevolution with the host system. Based on slim accretion models and numerical simulations, they argued for accretion episodes that lasted 103–105 yr and for flow regeneration periods of 104–105 yr. Intermittent accretion was also discussed critically by Gilli et al. (2017). Consequently, either the accretion history of GN-z11 SMBH begins at a massive enough initial seed or its accretion time span (and its total age) must be long enough to accommodate enough intermittent super-Eddington accretion phases.
Before we address the AGB solution to the observation of N-rich gas in the vicinity of an SMBH in high-redshift objects in more detail, we briefly also discuss the possibility that the accretion modality itself is the source of the N-rich gas. Attention has recently been paid to modelling stars that either directly formed in the SMBH accretion disk or were captured into the disk from the surrounding star cluster, and to their evolution through mass accretion and subsequent wind ejection of stellar gas mixed down to the stellar core (e.g. Cantiello et al. 2021; Dittmann et al. 2021; Fabj et al. 2025). The modelling of the capture of stars in the accretion disk was originally devised to explore a scenario in which the variability of AGNs is fuelled by the engulfing of such stars by the BH (Syer et al. 1991). The application to the formation of binary black holes and their merging (e.g. Wang et al. 2021) was discussed later. The possibility of growing the stars that formed in the disk up to very high masses and trying to understand the consequences of this type of evolution on the global properties of the gas surrounding the BH is clearly fascinating. In principle, the balance between the mass lost in winds from the supermassive stars living in the accretion disk and the mass accreted from the same disk, which replenishes hydrogen into the H-burning stellar core through full convective transport, can prolong the core H-burning phase of these objects for a long time. They are also called “immortal” stars for this reason. The winds that consist of gas that was processed through the CNO cycle in the stellar core might be the source of the N-rich gas seen in the region of the young galaxies close to the AGN. This hypothetical scenario depends on several schematic hypotheses and adjusted parameters that are necessary to consider i) the structure of the accretion disk, especially in the very outer region where the disk becomes gravitationally unstable, fragments, and forms stars (Collin & Huré 2001); Fabj et al. (2025) show the differences in the disk structure obtained by adopting two very different schemes; ii) the stellar accretion modelling (Cantiello et al. 2021); iii) the structure of the accreting star itself (Chen & Lin 2024; Dittmann & Cantiello 2025); and iv) the feedback effects produced by the accretion itself. For this latter problem, the most probable scenarios for the SMBH growth require cycles of accretion rates on much shorter timescales than the lifetime of 100 Myr of stationary AGN accretion envisioned in the models of immortal stars, as discussed above. Finally, we mainly study an N-loud young AGN with a value of log(N/O) so high that all massive star models have serious difficulties to explain it. This further motivated us to explore different models for this phenomenon. We briefly return to this point in the discussion, but concentrate on the more standard role of the NSC stars as a source of the N-rich gas in the main body of the paper.
We discuss the hypothesis that we witness a phase in the galaxy life during the evolution of the massive AGB stars of the central NSC. If this is the case, we may possibly obtain an independent and stronger age constraint than provided by the redshift alone. We first asked whether this constraint can be applied to other systems to efficiently determine the ages of the growing BH and constrain their mass growth with time. The analysis yielded an unexpected insight into the problem.
We studied the N/O and C/O abundances of a few high-redshift systems with N-loud AGN and compared them with those of AGB ejecta. The location of AGB ejecta in the plane log(N/O) versus log(O/H)+12 is briefly discussed in Sect. 2.2. The remarkably high N/O abundance of the system GS_3073 (Ji et al. 2024) is hardly compatible with any of the other chemical evolution models proposed in the literature, but is fully consistent with the composition of pure AGB ejecta. This is analogous with the extreme populations in the massive GC ω Centauri (ω Cen). We therefore summarise the inferences on the evolution of an NSC including a BH component from the study of ω Cen as a possible prototype of these systems (Sect. 3). On this basis, we attribute an age to GS_3073 and also revise the age attributed to GN-z11 in D’Antona et al. (2023) (Sect. 4). We discuss the consequences for the accretion modalities based on the BH mass versus age relation in Sect. 5, and we summarise the results in Sect. 6.
2 Exploring and modelling the nitrogen-rich gas in high-z AGN
Two major questions are raised by the recent JWST observations discussed in Sect. 1: (1) what are the initial seed masses of the objects eventually evolving to become the SMBH at the centre of galaxies and what is their accretion and merging history leading to large SMBH masses in less than a billion year (e.g. Volonteri 2010; Volonteri et al. 2021); (2) why do so many of these systems at early ages (a half, according to Isobe et al. 2025) show larger Nitrogen abundances close to the central BH.
2.1 A sample of N-loud high-z compact systems containing an AGN
In Table 1, we list four systems sharing the property of (i) high redshift; (ii) high N/O ratio in the spectra; (iii) very probably hosting a SMBH. The systems are listed in order of increasing BH mass.
The presence of a SMBH in these systems is very tricky indeed, as the way the abundances are derived depends on whether the emission lines are excited by the stellar radiation or by the harder emission of the AGN (Isobe et al. 2023), thus for GN-z11 and CEERS 10191 we show the results for both hypotheses, and have to keep this caveat in mind.
The location of GHZ9 (Napolitano et al. 2024) appears similar to the standard location of GN-z11 (Cameron et al. 2023), but (O/H) is not determined, so it is plotted with the location corresponding to a plausible interval from 0.01(Fe/H)⊙ to 0.1(Fe/H)⊙.
The N/O of two objects, GS_3073 and CEERS 1019 (in the AGN spectrum hypothesis), are at values much higher than GN-z11, log(N/O)∼0. and 0.4.
For the most interesting case, GS_3073, we plot in Fig. 1a both the “UV dense” fiducial determination (red pentagon), corresponding to the spectrum from the region closest to the BH, its lower limit (grey triangle) and the optical determination (red square) from Ji et al. (2024). The latter value is not different from the average abundances in galaxies at the same level of metal-licity, so probably the anomalous high nitrogen is confined to a limited region in the proximity of the AGN. Unfortunately, the dimensions of this region are not known, precluding more quantitative analyses, but not diminishing the interest of the measured abundances.
Looking at the location of the four objects in the log(C/O) versus log(O/H) plane (Fig. 1b) we point out another possibly interesting feature: the (C/O) of GS_3073, also considering its lower limit, is quite normal with respect to the abundances of the objects plotted in this plane, but the fiducial point is somewhat higher than the abundance of GN-z11, and it is also large with respect to the bulk of the ejecta abundances of the massive AGBs.
Data for four N-loud compact systems at high redshift containing a BH.
 |
Fig. 1 Abundances in GN-z11, GHz9, CEERS 1019, and GS_3073 compared with models. Panel a: diagram log(N/O) vs. log(O/H)+12. For GN-z11 and CEERS 1019, we show the standard locations in the literature and the locations based on models by Isobe et al. (2023) including the AGN radiation (see Table 1); for GS_3073 we show the fiducial (red pentagon) and lower limit (grey triangle) derived from the UV-dense lines, monitoring the region closest to the AGN, while the log(N/O) from optical lines are the red square (without outflow) and the reverse grey triangle (with outflow). The colour scale on the right defines the metallicity of the different sets of mass-averaged ejecta composition (triangles) for initial AGB masses from 7.5 to 3 M⊙- or 2.5 M⊙ in one case from the models by Ventura et al. (2013). The metal mass fractions of the tracks Z and the corresponding [Fe/H] are Z=0.0003 ([Fe/H]=–2), 0.001 (–1.5), 0.002 (–1.2), 0.004 (–0.75), and 0.008 (–0.45). A few masses are also labelled as reference. The yellow band shows the reference location of ejecta dominated by hot bottom burning as a function of log(O/H). Stars represent the initial O/H and N/O abundances of the models. The solar symbol is placed at the values corresponding to solar abundances. At the bottom we show the upper (full line) and lower (dashed line) envelope of the chemical evolution models by Vincenzo et al. (2016). Panel b: diagram log(C/O) vs. log(O/H)+12. The symbols and lines are the same as in panel a. |
2.2 The limitation of the abundances of AGB ejecta in the plane log(N/O) versus log(O/H)
In Fig.1a we plot the average abundances in the ejecta of AGB stars of different metallicities, from the work by Ventura et al. 2013, going from Z=0.0003 to Z=0.0082. The abundances in the starting main sequence models are represented by the asterisks.
These average abundances are the result of wind mass loss which progressively (on timescales of about a few×105 yr, depending on the evolving mass) expels from the stellar surface the whole convective envelope until the remnant carbon oxygen core is left and cools off as white dwarf. The structure of massive AGBs are such that their convective envelope reaches the edges of the H-burning shell, and the whole envelope gas is processed at the high temperatures, THBB, of this hot bottom (hot bottom burning or HBB). The THBB reach progressively values from 40 to 100 MK, provoking p-capture processing on all the light elements involved. In particular, the C and N abundances reach quasi equilibrium abundances, while the oxygen conversion to nitrogen goes on for the whole evolution, and the N/O reached is limited by the finite lifetime of the AGB phase due to mass loss.
With respect to the models plotted in Fig. 1 of D’Antona et al. (2023), the initial masses are extended, to 3 or 2.5 M⊙, showing the change in the ejecta composition. The upper mass models (7.5-6.5 M⊙) are dominated by mass loss, so the oxygen abundance is not significantly reduced, in spite of high THBB ; the full CNO processing becomes the dominant effect for the 6– 5 M⊙; for smaller masses, THBB decreases and oxygen becomes less depleted again (~4 M⊙); finally the third dredge up (Iben & Renzini 1983) becomes dominant, the NO cycling is no longer efficient, and the models transition to C-star (about 3 M⊙).
In the plane log(N/O) versus log(O/H), models of different metallicities are located along a diagonal band tracing the increasing efficiency of CNO cycling as THBB increases for lower and lower metallicities. The efficiency of HBB is directly dependent on the opacity of the envelope, and thus mainly on the iron content of the mixture. The diagonal band location for our models does not depend on the α elements enhancement with respect to the solar ratio3, as the α enhancement affects the oxygen abundance, and thus it affects in the same way both the abscissa and ordinate of the plot, and the ejecta shift along the band shaped by the models of different (Fe/H). The diagonal band is then the limit to the abundances we can expect to see in AGB ejecta. Abundances smaller than those in the yellow strip – such as in GN-z11 and other N/O rich systems – can be obtained by a mixture of ejecta with the infall gas abundances. In standard GCs this mixing is with gas having the primordial composition of the cloud forming the first-generation stars, so the mixing line would go from the diamond of the ejecta of the evolving mass to the star of the corresponding initial composition (in Fig. 2, the star of the same colour). In these complex high-z systems, the metal-licity of the infalling matter may be a bit different, e.g. smaller. In any case, the diluting line will go from the strip points down to the stars points, and cannot, e.g. go to other points along the strip. An example of the dilution necessary to fit the location of GN-z11 is shown in Fig. 1 of D’Antona et al. (2023).
The vertical location (the values of N/O for each O/H) is very dependent on the efficiency of convection in the AGB envelope and on the mass loss description (Ventura & D’Antona 2005a,b). Our own models are those which best conform to the abundances observed in GCs, and are at the basis of the AGB model for the formation of multiple populations (D’Ercole et al. 2008; D’Antona et al. 2016; Calura et al. 2019), so they are the most appropriate also in this context. For example, the models by Karakas (2010) and Fishlock et al. (2014) adopt lower efficiency of mass loss with respect to ours, so the AGB evolution proceeds through a much larger number of helium thermal pulses, during which the outer H-rich convective envelope deepens into the helium intershell and dredges up the products of 3α burning, mainly carbon. Thus the total CNO in the envelope increases dramatically, at variance with the abundances in GCs, where the total CNO varies at most by a factor two between the first and second generation stars.
For a quick reference, the strip location highlighted in yellow in Fig. 1a follows the relation:
 (1)
(1)
2.3 Modelling the high nitrogen in compact objects at high z
The high N/O ratios of the objects listed in Table 1 and plotted in Fig. 1 require some care to be put into context. The first obvious point is that these N/O values are anomalous, they cannot be achieved easily in the context of normal chemical evolution models, calibrated on standard signatures of how the elemental abundances evolve in time, taking into account all kinds of stellar polluters (supernovae, winds, mass loss from binaries) together with possible infall sources (as in the models by Vincenzo et al. (2016) plotted in the figure). So the high N/O of these high z sources belong to some anomalous phase, probably of short duration and not influencing the global chemical evolution.
One interesting aspect of this problem was shown by Kobayashi & Ferrara (2024): assuming one burst of star formation, high N is obtained from the Wolf–Rayet yields, but at the same time oxygen increases too much. So a plausible model invokes a first burst of star formation, followed by a decrease of oxygen thanks to infall of primordial gas, and finally another burst of star formation, some 100–200 Myr after the first one, to produce again high N, for a very short time, through the Wolf Rayet channel.
Rizzuti et al. (2025) avoid the overproduction of oxygen in the bursting star formation events, assuming that the fast ejecta of supernovae are lost by the system, while the slower stellar wind products (secondary – and sometimes primary – nitrogen) remain in the system and pollute the interstellar gas. These models well explain GN-z11.
Other models explore the possible role of Very Massive Stars (VMS) (Vink 2023). In these stars the winds will be slow in the first phases of evolution and should be able to produce the high N in GN-z11 and in other young star-forming galaxies at high redshift.
A final attempt is made by Nandal et al. (2024), who resorted to Pop. III stars well above 1000 M⊙ to reproduce the N/O in GN-z11.
When we limit ourselves to objects hiding an AGN, the high star formation rate and very young age of the system are no longer mandatory, and also the AGB role can be considered, as discussed in D’Antona et al. (2023).
2.4 The very high N/O in GS_3073
An interesting problem arises when we consider the extreme log(N/O)=0.42 of the high density region of GS_3073 close to the AGN. The formal full equilibrium values for CNO burning are (log(NZO)~1, log(CZO)~-0.3 (Isobe et al. 2023; Maeder et al. 2015), but the average N/O abundance of massive stars are generally much lower than this (see, e.g., the sketch figure 4 in Isobe et al. 2023) – and we have seen above in Sect. 2.3 that they meet with difficulty, and for a short time, the much lower GN-z11 abundance ratios. Even the chemical evolutions by Rizzuti et al. (2025), successful in explaining the high N/O in the other objects, had to resort to two peculiar models to reach the N/O in GS_3073: one with extremely short infall timescale and extreme rotation rates, evolved for 50 Myr, and another one with a much longer evolution time of 200 Myr. Note that this latter timescale implies indeed a contribution from AGB winds to the chemical composition of the gas, and in many ways is similar to the hypothesis we develop in the present work. The model with extreme infall corresponds to an exceptionally high star-formation rate, so an accurate measurement of this quantity would be crucial for distinguishing between these two scenarios.
A recent work (Nandal et al. 2025) shows that the abundances in GS_3073 can result from the evolution of 1000– 10 000 M⊙ Pop. III stars, under some specific assumptions on the mass lost by these stars, and the precise evolutionary stage at which it is lost. Anyway, it is unclear how supermassive objects with no metals could form at such a late stage of evolution, as we are looking at a system containing a SMBH of 1.6 × 10⁸ M⊙ at z=5.5. For example, hydrodynamic simulations show that, within an individual galaxy, the metal production and stellar feedback from population II stars overtake Pop. III stars in 20–200 Myr, depending on galaxy mass (Muratov et al. 2013).
In the AGBs subject to HBB the evolution of abundances does not reach CNO equilibrium, but we see that the log(N/O) of GS_3073 is well matched by the AGB ejecta. As noted above, values of N/O such as in GN-z11 can be fit by diluting the abundances of the AGB ejecta with infalling gas with standard composition (D’Antona et al. 2023), a procedure that is also used to explain the abundances in GC stars of second-generation. In the case of GS_3073 we seem to be looking at undiluted ejecta close to the AGN. Is the presence of undiluted AGB ejecta possible and reasonable? It is possible that the region in the close vicinity of the BH becomes periodically free of all the gas which has been either rapidly accreted on the central BH (as in the intermittent accretion modelling), or has gone through a burst of star formation, so immediately after each episode of rapid gas depletion the main new contribution to the gas we see comes from the winds from the closest AGB stars, hosted in the putative NSC and evolving at the time we are observing the system. The accretion rate in GS_3073 is largely sub-Eddington (Übler et al. 2023), so we might indeed be looking at one of these phases, in which the region closest to the BH is being replenished by the AGB gas.
From a more general point of view, we know that in standard GCs the second generation contains, in some cases, a fraction of stars born from pure ejecta: these have extreme p-processing signatures and very large helium content, in mass fraction Y~0.35-0.40.
In particular we know that ω Cen (likely the remnant NSC of a disrupted dwarf galaxy) probably hosts a number of extreme populations with a wide range of metallicities (e.g. Johnson et al. 2009; Marino et al. 2011; Bellini et al. 2017; Clontz et al. 2025), supporting the idea of recurring star formation phases during which stars form out of only pure AGB ejecta in the central regions of the system (e.g. D’Antona et al. 2011).
2.5 Formation of multiple populations in standard GCs and in NSCs based on the AGB model
We are adding together two very important potential features of some compact high-z objects including an AGN component: 1) an NSC in the centre of a more extended galaxy like GN-z11 is the right place where to form and grow the BHs seeds of an SMBH; 2) the stars evolving in the NSC, after only 40 Myr, can become sources of high-N gas.
Let us consider the fate of the winds of the evolving AGBs: a part of them probably takes part in new events of star formation, like it occurs in standard GCs for the formation of the second-generation stars (see, e.g. D’Ercole et al. 2008). Stars in standard GCs, however, are characterised by a small Fe and age spreads. NSC evolution is qualitatively different, as they host many populations differing in metallicity and age (see the review by Neumayer et al. 2020). The extended star formation history in NSCs may be reconstructed by fitting their integrated spectrum (Walcher et al. 2005; Kacharov et al. 2018), and by studying the single stars. The NSC formation occurs thus on longer lifetimes than the standard GC formation, and has the advantage of allowing for massive accretion of gas from the outside, which help to build up many stellar populations. Unlike in standard GCs, matter ejected by exploding supernovae in NSCs is not expelled, thanks to the high escape velocity, and, together with infalling matter, it allows the formation of several subsequent generations with increasing metallicity, while the gas also accretes on the core SMBH. Complications to consider include the gas ejection in jets from the SMBH, and the possible merging with other systems, including additional stars populations and gas.
If the formation of the populations in an NSC may be very extended in time, we probably have to revise the assumption in D’Antona et al. (2023) for the evolution of GN-z11. We assumed that the most massive stars of the first-generation of the NSC progenitor ended their life as the BHs seeds of the SMBH, and that the AGB winds of the stars of this same generation were responsible for the specific composition seen in the spectrum, so the age of these AGBs would also be the total age of the system, fixing it to ~70-130Myr.
This is not the only possible conclusion. We can consider another case: 1) the seed BHs were born in a first very metal poor population; 2) we are instead looking at the winds from the stars born in more recent events of star formation, in the gas metal enriched by the local supernovae. Under this scenario, we have to estimate the timescale on which the recent parent stellar generation was born.
To gain further insight into the formation and chemical history of high-z objects like GN-z11 and GS_3073, we can compare these systems with the very well known proxy ω Cen, the cluster considered a NSC which has lost the surrounding galaxy, probably the dwarf galaxy Gaia-Sausage/Enceladus (e.g. Lee et al. 1999; Pfeffer et al. 2021; Limberg et al. 2022). Under the assumption that indeed ω Cen is a stripped NSC, Limberg et al. (2022) estimate the stellar mass of its progenitor to be ~1.3 × 10⁹ M⊙. The system also harbours a central BH with an estimated mass of ~8000 M⊙ (Haberle et al. 2024): in summary, it resembles the initial phases of the high z systems we are dealing with, in a framework such that the BH growth has been stopped at a very early stage. Also its stellar populations have stopped forming at early times, allowing a better comparison with the early evolution of the high-z objects.
3 ω Cen as a proxy example
A directly appealing reason to consider ω Cen an example of the early formation history of an NSC is highlighted in Figure 2, showing where the giants in ω Cen are located in the log(N/O) versus log(O/H)+12 plane. Data for the giants are from Marino et al. (2012). Two features immediately emerge: (1) the yellow strip of AGB ejecta composition is a natural limit to the observed abundances; (2) a fraction of the sample stars, at all metallicities apart from the lowest abundance bin, are actually on the yellow strip, implying, in the context of the AGB model, that they were born from pure gas ejected by AGBs of the NSC (with a caveat which we will discuss later). It looks like the red pentagon representing the abundances in the dense region of GS_3073, similarly located on the yellow strip, is a sort of snapshot of the core of ω Cen at some precise point of its chemical evolution history. The analogy may serve as a guide to understand the status of GS_3073.
The data shown in Fig. 2 are only one among the evidences that extreme second generation stars form at all metallicities in ω Cen, but it is necessary to summarise other important hints, based on other abundance patterns and on the interpretation of photometric data.
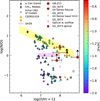 |
Fig. 2 Abundances (triangles) in the plane log(N/O) vs. log(O/H)+12 for a sample of ω Cen giants by Marino et al. (2012) for [Fe/H] according to the scale at the right. The abundances in GN-z11, GHz9, CEERS 1019, and GH3073 are displayed as in Fig.1. The yellow diagonal strip represents the locus of pure AGB ejecta of intermediate masses for a wide range of metallicities defined by the models shown in Fig. 1. The stars symbols show the initial abundances of the evolved models, and the diamonds on the strip represent the ejecta of 5 M⊙ of the different sets of tracks. |
3.1 Spectroscopic data
While the metallicity of ω Cen stars spans much more than a dex, the high dispersion spectroscopy data by Johnson et al. (2009) and Marino et al. (2011) have shown that the abundances of p-capture elements in each of the metallicity groups are anticorrelated, with patterns similar to those found in simpler GCs having no spread in metallicity (Carretta et al. 2009). This suggests that ω Cen passed through a complex evolution, with similarity and differences to the stages forming multiple populations in GCs. The main results were clear:
the stars in the lowest metallicity bin ([Fe∕H]<-1.9) show a mild O–Na anticorrelation;
in the intermediate metallicity bins, −1.9< [Fe∕H]<-1.3, the O–Na anticorrelations (and other anticorrelations) are very extended, implying that a fraction of stars is extreme in abundances, and another large fraction shows abundances intermediate between the standard and extreme abundances;
in the high-metallicity bins ([Fe∕H]>-1.3) a large majority of stars has extreme abundances and are characterised by a O–Na direct correlation4;
the stars with low Na and high O (identified as first-generation stars, as they have abundances similar to the halo stars) are scarce or missing in the high metallicity bins.
Complementary to these data, Fig. 2 shows that the log(N/O) ratio versus oxygen hosts stars with standard or intermediate N/O abundances (but not the higher metallicity stars), and the stars with the lowest metallicity do not reach extreme N/O (violet triangles do not populate the yellow strip). The stars with highest metallicities are indeed almost all extreme in N/O, they lie on the yellow strip of pure AGB ejecta.
3.2 The chromosome map
Marino et al. (2019) displayed the abundances from high dispersion spectra in the chromosome map (Milone et al. 2017) of ω Cen - where the ordinate pseudo-colour represents mainly nitrogen – showing that the high dispersion results hold also for a much more abundant (photometric) sample: for most of the metallicities (apart from the lowest ones) a fraction of stars has the highest p-capture abundances, and the first generation stars are scarce or absent at the high metallicity. Similar results have been recently found by Clontz et al. (2025), who matched the chromosome map data with the metallicities determined in low dispersion MUSE spectra for thousands of stars.
3.3 The photometric evidence
In ω Cen standard photometry in the optical bands shows the presence of a blue main sequence (Bedin et al. 2004), matched by isochrones with very high helium content, e.g. Y≃0.39±0.02 (King et al. 2012), or Y≃0.37 (Tailo et al. 2016). Subsequently, colour magnitude diagrams in the UV HST bands, complemented with the chromosome maps of the stellar groups photometrically identified, allowed Bellini et al. (2017) to reveal more than 15 different populations. Among them, there are in total 8 populations with high helium: three constituting the blue MS, three in what they call MSd (hidden beyond the red MS in standard CM diagrams) and two in the MSa, the very red and metal rich part of the diagram. These result for the main sequence match the finding, quoted above, of a high helium abundance (δY~0.15 with respect to standard) in all the popula-tions5 of the upper portion of the giants’ chromosome map from the oMEGACat survey (Clontz et al. 2025).
3.4 Modelling the star formation in ω Cen
In the context of the AGB model (D’Ercole et al. 2008), the high helium stars are stars born from pure AGB ejecta. The helium abundance in the envelopes of massive AGB results from the second dredge up occurring between the H-rich envelope of the giant and the H-exhausted core before the model climbs up the AGB, and is independent from all the input parameters (e.g. mass loss rates, convection efficiency) that affect the abundances of elements subject to p-captures during the HBB phase. Standard models for massive AGBs predict typical values for the helium abundance of Y=0.34–0.36. These values can be slightly different for different assumptions made in the models, so any formal discrepancy with observations should not be considered as a reason to discard the model6. In Fig. 2 we have formally extended this result to the CNO abundances, showing that some stars of ω Cen, at different [Fe/H], have the CNO abundances of pure massive AGB ejecta.
Second generation star formation in the AGB model occurs in the GC’s inner regions, where a cooling flow collects the AGB ejecta (D’Ercole et al. 2008). The formation of stars with extreme chemical abundances from pure AGB ejecta must occur in a phase when the cluster’s central regions are devoid of any gas with pristine chemical composition, out of which first-generation stars formed, before any further infall of external pristine gas occurs. There is one standard GC for which this clearly happened: NGC 2808, where both the presence of a high-helium main sequence and the extension of the horizontal branch stars (Piotto et al. 2007; D’Antona & Caloi 2008) signal a population born from pure AGB ejecta.
In our putative NSC ω Cen, the formation of extreme stars must have occurred several times, at different metallicities. These multiple episodes of formation of extreme 2G stars in the core of ω Cen could be linked to the action of the central black hole, periodically sweeping out the gas from its surrounding regions. This hypothesis allows a qualitative analysis of the phases of star formation in ω Cen in the framework of the AGB model. If the gas in the central regions of the NSC, from time to time, is fully swept out, it is initially replenished only by the winds of the AGB population of the NSC, allowing formation of extreme second generation stars, either in a burst or in a quiet star formation event. Subsequently infall of gas with pristine chemical composition will result in the formation of 2G stars out of AGB ejecta diluted with pristine gas and thus with intermediate chemical composition. If the infall event is massive, large scale star formation occurs, and the new stars formed will have a metallicity increased by the pollution of the local medium caused by the previous core collapse supernovae.
In the context of the AGB model we are presenting, the formation of the extreme populations at increasing [Fe/H] must be a recurring event, because, at each time, AGB ejecta of different metallicities merge in a single cooling flow and mix, forming new populations with scarce spread in iron. Recent analyses of the chromosome maps show that in the galactic GCs where there is a measurable metallicity spread of the first generation stars, the 2G stars display a much smaller spread (Legnardi et al. 2022; Latour et al. 2025), a result consistent with what we expect if the 2G forms in a compact well mixed region in the cluster core. Thus, in ω Cen, the AGB stars contributing to the extreme populations of each given metallicity must be in a limited range of metallicities, so that their mixed iron abundances do not exceed the range. This may be the reason why the lowest metallicity bins do not host stars with extreme anomalies, e.g. stars with maximum helium difference with respect to the initial abundance (Clontz et al. 2025) or with maximum CNO cycling, as shown by the lack of points from Marino et al. (2012) with [Fe/H]<–1.9 on the yellow strip in Fig. 2. In each [Fe/H] bin, stars with much larger [Fe/H] are not yet old enough to contain evolving AGB masses. This simple argument allows to estimate a time lapse tdelay ∼100 Myr till the occurrence of the major event forming stars of [Fe/H] in the range between –1.5 and –1.2.
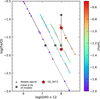 |
Fig. 3 Range of lower limits for log(Fe/O) for GS_3073 compared with the model ejecta values for the different sets of metallicities from Z=0.0003 (lower line) to Z=0.004 (upper line). |
4 Full dating of GS_3073 and GN-z11
4.1 Dating the stars that lose winds with high N/O
In Fig. 1, we see that the abscissa O/H is not a proxy of the metallicity of the models, but their O/H abundance in the ejecta: oxygen can be depleted, but also larger with respect to the initial abundance, depending on whether the specific mass in evolution is in HBB (oxygen depleted) or is dominated by dredge up. If we are looking at pure ejecta, then the specific metal-licity of the AGB stars in play is not formally well fixed. One option to constrain the Fe abundance relies on the comparison between the observed range of log[Fe/O] in Ji et al. (2024) and the corresponding values from the models ejecta (Fig. 3). We can immediately exclude the very low metallicity (Z=0.0003, corresponding to [Fe/H]=–2 for our choice of α elements overabundance) as the ejecta do not match any of the abundances, neither N/O nor Fe/O nor O abundances. As we have discussed for the case of ω Cen, we expect to be in a relatively late stage of the NSC evolution. where the supernovae Type Ia have begun exploding. When we refer to pure AGB ejecta, we refer to ejecta not diluted with pristine infalling matter but contamination with the local iron ejecta of SN Ia is unavoidable. This implies that we can rule out that the AGB progenitors of the gas we see belong to the Z=0.004 models, corresponding to [Fe/H]=–0.75, although the model ejecta pass through the high fiducial lower limit location of GS_3073 (upper red pentagon). Such an Fe/O value implies that oxygen is approximately in solar proportions with respect to iron, that is, that the α elements are not overabundant in the gas we are seeing. But the system GS_3073 at such an early age should have the α elements overabundances of population II stars, unless it has been actually contaminated by SN Ia iron, as we say. Thus the AGBs responsible for the high N/O must have a smaller initial [Fe/H].
We are left with the intermediate cases, Z=0.001 ([Fe/H]= –1.5) and 0.002 ([Fe/H]=–1.2).
In Figure 4 we compare the abundances of log(N/O) and log(C/O) of the ejecta for [Fe/H]=–1.5 and –1.2 as a function of the initial AGB mass, with log(N/O) and log(C/O) for GS_3073 (green dashed regions). Considering at the same time both N/O and C/O fiducial points with their formal errors, the comparison suggests that we are looking at winds from the following initial mass ranges:
[Fe∕H]=−1.5 M=4−3.5 M⊙ age: 170-230 Myr
[Fe∕H]=−1.2 M=4−3.0 M⊙ age: 170-340 Myr.
To these specific ages we must add the time tdelay, elapsed from the formation of population 1 (which defines the birth of the seed BHs) till the infall episode giving origin to the progenitors of the AGB gas we are considering. For these times we have established lower limits in our schematic model for ω Cen, and estimated at a tdelay≳100 Myr the birth of the populations at [Fe/H]=–1.5 and –1.2. Summing up the ages, the total age range is >270-330 Myr for [Fe∕H]=−1.5 and >270−440Myr for [Fe/H]=−1.2. In summary, we predict that the total age of GS_3073 is 270–440 Myr, and that this is the time interval during which the SMBH of this system accreted mass and reached the present day mass of −1.6 × 10⁸ M⊙ from its initial seed mass.
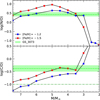 |
Fig. 4 Comparison of the abundance of ejecta as a function of the mass for [Fe/H]=–1.2 and –1.5. The fiducial abundance regions for GS_3073 are the green strips, while the green dot-dashed line represents the lowest possible abundance for log(C/O). The evolving masses which best reproduce the fiducial abundances of the UV dense region close to the SMBH are ~4-3.5 M⊙, for Z=0.001 and 4-3 M⊙ for Z=0.002. |
4.2 Dating again GN-z11
We now estimate the age of GN-z11 in the context of the theoretical framework presented in this paper. In D’Antona et al. (2023) we have dated the system by assuming a single stellar population forming both the NSC and the BH seed, simply because the N/O of GN-z11 requires dilution with pristine gas, and interpreted the observed abundances assuming the system was similar to a simple GC. Nevertheless, the NSC in this system may be as complex as in ω Cen, and the estimated ages of the evolving AGBs must be increased to account for the time spent from the birth of the first population of the NSC and the birth of the specific population which gave origin to the winds in question. Considering that intermediate populations in ω Cen are present only up to [Fe∕H]≃-1.6 (Clontz et al. 2025) a tdelay−100 Myr looks adequate, again in the hypothesis that the (larger) [Fe/H] of GN-z11 results from pollution by SN Ia. The most typical age range of the first population AGBs is to 50–130 Myr, so the age of the system increases to −150-230 Myr. This would mean that the NSC formed −190-310 Myr after the Big Bang, at z=17.7–14.3.
4.3 AGB stars as a plausible source of the N-rich gas
It is well known that the formation of second generation stars in standard galactic GCs requires that the initial cluster mass is larger than the present day total mass. In the present case, we are dealing with structures which are not ending into standard GCs, at least because the deep gravitational well necessary to maintain into the clusters the interacting BHs also prevents to some extent the expulsion of supernovae ejecta, so that populations differing in metallicity are expected to be present. Further, we are dealing with high-z systems, where merging with other clusters or massive gas accretion from the surroundings is expected and, in fact, is needed to grow the mass of the central BH. Thus the mass budget does not pose a discriminant problem at this stage.
The mass of the N-rich ionised gas has been found to be ~1.2 × 10⁵ M⊙ for CEERS-1019 (Marques-Chaves et al. 2024) and ~2 × 10⁵ M⊙ for GN-z11 (Charbonnel et al. 2023), although, according to Maiolino et al. (2024a), the latter value could be smaller. For GN-z11 the measured N/O may be the result of a mixture of AGB ejecta and infalling (standard N/O) gas. D’Antona et al. (2023) found that the abundances were compatible with 40% ejecta diluted with 60% infalling gas. On the contrary, CEERS-1019 lies close to the yellow strip of the pure AGB abundances in the plane log(N/O) vs. log(O/H) (see Fig.1) so its gas in our interpretation should be scarcely diluted.
Let us now ask what a mass of ~1.2 × 10⁵ M⊙ implies if it were seen in GS_3073. In this case, we have shown that it should come mainly from undiluted ejecta. We have also shown that the mass range 3-4 M⊙ is most probably contributing to this gas. Assuming a Kroupa (2001) stellar initial mass function, with lower an upper limits equal to, respectively, 0.08 M⊙, 100 M⊙, stars in the range 3-4 M⊙ provide an amount of AGB N-rich wind ejecta equal to about 3.3% of the total stellar mass of the system. Consequently, an initial mass of 3.6 × 10⁶ M⊙ for the cluster providing these ejecta would be needed.
5 Consequences for the mass-accretion rates in GN-z11 and GS_3073
We report the BH masses of the four objects listed in Table 1 versus the age corresponding to their redshift (black squares) in Fig. 5, where we also show the location of the quasars at 6<z<7 from Inayoshi et al. (2020). In order to understand the additional information coming from the dating of GN-z11 and GS_3073 outlined in this work, we assume 200 Myr (z=19.5) as formation epoch for the seed BHs, at and plot the growing ages as red squares. We start at 200 Myr with initial stellar remnant seeds (located at 30 M⊙ in the figure) and assume that in 30 Myr they form a seed of 103 M⊙, starting point of the accretion phase. As we do not have any further age determination for GH-z9 and CEERS 1019, we leave them at their redshift age. With the choice of starting the NSC formation at z=19.5, also GH-z9, at its redshift age, is in agreement with the growing time within the uncertainty band.
We can compare the slope of the lines connecting the benchmarks with the standard growth timescales for accretion limited to the Eddington rate (Inayoshi et al. 2020):
 (2)
(2)
We take a duty cycle of accretion fduty=1 and a standard efficiency ϵ = 0.1. Mseed is the seed (initial) mass, which we take as 103, 1.5 × 10⁶ and 1.5 × 10⁸ M⊙ for the three phases of accretion delimited by the initial seed mass and by GN-z11 and GS_3073 BH mass. In Fig. 5 we see that growing the seed of 103 M⊙ up to the BH mass in GN-z11 requires a constant accretion at about twice the Eddington rate; slightly super-Eddington accretion is needed to reach the mass on GS_3073, and from this value to the masses of the quasars at z=6–7 accretion can be largely subEddington. Since the accretion rate is likely to be highly variable, the rates we find leave margin to form massive objects without invoking extreme accretion requirements.
This result compares well with the findings by Schneider et al. (2023): in the cosmological context they find indeed that a system like GN-z11 should start from heavy seeds to grow up to the present mass without super-Eddington accretion phases, but it may start from light seeds, if it formed at z=20–24 and was growing at super-Eddington rates.
If BHs can sustain high rates of super-Eddington accretion, even intermittent, as proposed in several theoretical approaches (e.g. Madau et al. 2014), we cannot exclude that even in GN-z11 the BH seeds were of standard stellar origin: 20-30 M⊙ remnants of the evolution of the massive stars formed together with the first stellar population. The stellar populations formed during the subsequent star formation events in the model also contribute to the growth of the central BH, by merging of newly formed stellar BHs or stars. Early merging with other star clusters, e.g. formed in the same dwarf galaxy (Garcia et al. 2025), may further help to reach the requested mass in a timescale so short. This, along with the longer epoch of star formation and BH accretion (~150-230 Myr) that we suggest in the present work, may significantly reduce the global average accretion rate required for this system if the seed BHs are light, remnant of standard stellar evolution (Maiolino et al. 2024b; D’Antona et al. 2023).
We focus again on the choice of the two first points mass versus tgrow plotted in Fig. 5. The standard assumption made in this work is that the original BH seeds are 20-30 M⊙, remnants of stellar evolution (Limongi & Chieffi 2018), that we are inside an NSC and that hierarchical repetitive mergers of these seeds lead to grow the BH mass, during the years preceding the end of the core collapse supernovae phase (a total of ~30 Myr) (e.g. Antonini et al. 2019), up to ~1000 M⊙. If clusters are so compact as those observed in the high-redshift Universe, such as in the Sunrise Arc and the Cosmic Gems (Vanzella et al. 2023; Adamo et al. 2024), a much faster growth – just a few Myr up to ~103 M⊙ - of the progenitors of the seed BH is possible, as found in recent simulations (Lahén et al. 2025) for clusters with stellar densities corresponding to very high surface densities (105 M⊙∕pc2). In this model thousands of stars have mass >8 M⊙, and several tens have mass >100 M⊙. One of the merged stars has indeed M> 1000 M⊙ and will collapse to a similar mass BH in a short time. Such massive remnants are also predicted by radiation hydrodynamic simulations of star-cluster formation, considering the interplay between metallicity, radiative feedback, and accretion dynamics in shaping the stellar populations in metal-poor environments (Chon & Omukai 2025), at least for metallicities [Z∕H]=10−2. The initial seed may then further grow by merging with the other stellar BHs remnants of the first cluster evolution, so that the mass at the second point in Fig. 5 may be even a factor 10 larger than our standard choice. Even with a very massive seed BH of 104 M⊙, super-Eddington accretion would still be needed to reach the mass of GN-z11, but the growth rate would be more similar to the rate between GN-z11 and GS_3073.
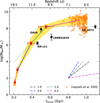 |
Fig. 5 Schematic view of the growth of the seed BH through the GN-z11 and GS_3073 masses up to the masses at z=6–7 (Inayoshi et al. 2020). The black squares show the BH masses versus the age of the Universe corresponding to the redshifts of the four systems in Table 1. We fix the zero age of the NSC formation at z=19.5 and age of the Universe of ~200 Myr. The initial masses for the BH evolution are in the range allowed for stellar BH remnants (in this plot 30 M⊙), and we assume dynamical merging to form a 1000 M⊙ seed during the first 30 Myr after their formation (dynamical evolution is represented by the red dotted line). We plot the systems GN-z11 and GS_3073 as red squares at the ages found in this work (plus the 200 Myr of the zero point of ages), based on the N/O and C/O versus O/H abundances of GS_3073, and on the idea that they correspond to pure AGB ejecta, in a NSC system evolution resembling ω Cen. GN-z11 is obviously very close to its redshift age, while the horizontal arrow shows the shift to the growing-age location of GS_3073. The accretion evolution is represented by the yellow band. The lines connecting the 1000 M⊙ seed and the average locations of GN-z11, GS_3073 and the quasars at z=6–7 give a qualitative idea of the mass growing rates. The slope for constant accretion rates equal to α times the Eddington mass accretion, with α=0.2, 1, 1.4 and 2 are shown for a qualitative comparison with the slope of the segments connecting the objects. The dotted green line extrapolates back in time the line α ≃ 1.4 connecting the locations of GN-z11 and GS_3073, and shows that an initial seed of ~104 M⊙ needs a uniform super-Eddington rate till the mass of GS_3073. |
6 Conclusions
We dated two N-loud AGNs in the young Universe under the requirement that the gas composition close to the BH comes from massive AGBs that evolve in the NSC that originally gave birth to the seed BHs. We focused our attention on the observations by Ji et al. (2024), who showed that the N-loud region in the system GS_3073 is confined to the central, dense, and highly ionised regions, hosting an SMBH of ~1.6 × 10⁸ M⊙ that accretes at a sub-Eddington rates (Übler et al. 2023). We showed that the extreme log(N/O)=0.42 of this gas is consistent with the undiluted average abundances of AGB ejecta. A straight comparison with the N/O abundances in the galactic GC ω Cen (likely the remnant NSC of a disrupted dwarf galaxy) shows that this abundance ratio matches the ratios that are expected at a specific point in the evolution of the abundances in the extreme populations of ω Cen. The analysis of the N/O, C/O, and Fe/O abundances allowed us to constrain the age of the AGBs that currently evolve in GS_3073 to 170–340 Myr. The presence in ω Cen of extreme populations with distinct, increasing [Fe/H] and the hypothesis that they form in a cooling flow indicate a time delay of ~100Myr from the formation of the NSC (and of the seed BHs) until the formation epoch of the progenitors of the AGBs that currently lose the gas observed in GS_3073. The final total age of the SMBH is then 270–440 Myr. A similar scheme applied to GN-z11 yielded a total age of ~150-230Myr. We lack sufficient information for the other N-loud AGNs we listed to constrain their age better than with the redshift age, but we conclude that the age of the system GS_3073 is far younger than the redshift age. When we include these two independent points in the diagram of MBH versus age, the first phases of BH growth with time must have been guided by phases of superEddington accretion. As shown in Fig. 5, the rate decreases with ageing when the starting seed BH is ~103 M⊙, consisting of the merging of stellar mass BHs during the first phases of the NSC evolution (Antonini et al. 2019). Even assuming a more extreme initial seed of ~104 M⊙, at the upper end of the VMS-SMS mass range predicted to emerge for the most compact NSCs (Fujii et al. 2024; Lahén et al. 2025), it would be necessary to have a rate of accretion of ~1.4 times the Eddington rate for the whole period until the age we determined for GS-3073. After ~300-5θθMyr, the rate becomes largely sub-Eddington. This result agrees with some theoretical predictions (e.g. Madau et al. 2014).
We conclude that the AGN – AGB connection may not only represent a direct explanation of the N-loud AGNs. When it is linked with data that are detailed enough for the system that is examined, for instance in the case of GS_3073, it may also add an independent estimate of the age of the system. This is a necessary step for studying the puzzle of SMBH growth. The key point of the model is that accretion onto the central BH in its first growth proceeds in intermittent phases of super-Eddington accretion that are followed by quiescent phases in which accretion slowly resumes, first mostly from the NSC N-rich stellar winds and then by phases of massive infall, during which the AGB winds are first diluted (and the gas remains N-rich at a lower level) and then become an insignificant fraction of the accreting gas. The finding that about half of the young N-rich galaxies have an AGN signature (Isobe et al. 2025) might be related to the relative timing of intermittent and accretion phases. We also theoretically defined a strip in the log(N/O) versus log(O/H) plane that limits the pure AGB N-rich ejecta from our updated models (see, e.g. Ventura et al. 2013). In the proposed scheme of intermittent super-Eddington accretion, we identify the objects on the strip as AGNs that resume accretion from ejecta, the objects with lower N/O (but higher than solar, at oxygen lower than solar) as AGNs accreting from ejecta and infalling gas, while the AGN with standard N are the sources that mostly accrete from infalling gas.
Independently, we proposed a scheme for the presence of multiple extreme second-generation stars in ω Cen. We attributed their formation to the action of the central BH that sweeps the gas from the core regions in which these populations are then born from a pure AGB cooling flow.
Acknowledgements
This work has been funded by the European Union – NextGenerationEU RRF M4C2 1.1 (PRIN 2022 2022MMEB9W: “Understanding the formation of globular clusters with their multiple stellar generations”, CUP C53D23001200006).” EV acknowledges support from NSF grant AST-2009193. We thank Raffaella Schneider and Marco Limongi for useful insight on many facets of this work.
References
- Abramowicz, M. A., & Lasota, J. P. 1995, Comments Astrophys., 18, 141 [Google Scholar]
- Adamo, A., Bradley, L. D., Vanzella, E., et al. 2024, Nature, 632, 513 [NASA ADS] [CrossRef] [Google Scholar]
- Antonini, F., Gieles, M., & Gualandris, A. 2019, MNRAS, 486, 5008 [NASA ADS] [CrossRef] [Google Scholar]
- Bedin, L. R., Piotto, G., Anderson, J., et al. 2004, ApJ, 605, L125 [Google Scholar]
- Bellini, A., Milone, A. P., Anderson, J., et al. 2017, ApJ, 844, 164 [NASA ADS] [CrossRef] [Google Scholar]
- Belokurov, V., & Kravtsov, A. 2023, MNRAS, 525, 4456 [NASA ADS] [CrossRef] [Google Scholar]
- Bromm, V., & Loeb, A. 2003, ApJ, 596, 34 [Google Scholar]
- Bunker, A. J., Saxena, A., Cameron, A. J., et al. 2023, A&A, 677, A88 [NASA ADS] [CrossRef] [EDP Sciences] [Google Scholar]
- Calura, F., D’Ercole, A., Vesperini, E., Vanzella, E., & Sollima, A. 2019, MNRAS, 489, 3269 [Google Scholar]
- Cameron, A. J., Katz, H., Rey, M. P., & Saxena, A. 2023, MNRAS, 523, 3516 [NASA ADS] [CrossRef] [Google Scholar]
- Cantiello, M., Jermyn, A. S., & Lin, D. N. C. 2021, ApJ, 910, 94 [NASA ADS] [CrossRef] [Google Scholar]
- Carretta, E., Bragaglia, A., Gratton, R., D’Orazi, V., & Lucatello, S. 2009, A&A, 508, 695 [NASA ADS] [CrossRef] [EDP Sciences] [Google Scholar]
- Chantereau, W., Charbonnel, C., & Meynet, G. 2016, A&A, 592, A111 [NASA ADS] [CrossRef] [EDP Sciences] [Google Scholar]
- Charbonnel, C., Schaerer, D., Prantzos, N., et al. 2023, A&A, 673, L7 [NASA ADS] [CrossRef] [EDP Sciences] [Google Scholar]
- Chen, Y.-X., & Lin, D. N. C. 2024, ApJ, 967, 88 [CrossRef] [Google Scholar]
- Chisholm, J., Berg, D. A., Endsley, R., et al. 2024, MNRAS, 534, 2633 [NASA ADS] [CrossRef] [Google Scholar]
- Chon, S., & Omukai, K. 2025, MNRAS, 539, 2561 [Google Scholar]
- Clontz, C., Seth, A. C., Wang, Z., et al. 2025, ApJ, 984, 162 [Google Scholar]
- Collin, S., & Huré, J. M. 2001, A&A, 372, 50 [NASA ADS] [CrossRef] [EDP Sciences] [Google Scholar]
- D’Antona, F., & Caloi, V. 2008, MNRAS, 390, 693 [CrossRef] [Google Scholar]
- D’Antona, F., D’Ercole, A., Marino, A. F., et al. 2011, ApJ, 736, 5 [Google Scholar]
- D’Antona, F., Vesperini, E., D’Ercole, A., et al. 2016, MNRAS, 458, 2122 [Google Scholar]
- D’Antona, F., Vesperini, E., Calura, F., et al. 2023, A&A, 680, L19 [NASA ADS] [CrossRef] [EDP Sciences] [Google Scholar]
- Decressin, T., Meynet, G., Charbonnel, C., Prantzos, N., & Ekström, S. 2007, A&A, 464, 1029 [NASA ADS] [CrossRef] [EDP Sciences] [Google Scholar]
- D’Ercole, A., Vesperini, E., D’Antona, F., McMillan, S. L. W., & Recchi, S. 2008, MNRAS, 391, 825 [CrossRef] [Google Scholar]
- Dittmann, A. J., & Cantiello, M. 2025, ApJ, 979, 245 [Google Scholar]
- Dittmann, A. J., Cantiello, M., & Jermyn, A. S. 2021, ApJ, 916, 48 [Google Scholar]
- D’Silva, J. C. J., Driver, S. P., Lagos, C. D. P., et al. 2023, ApJ, 959, L18 [CrossRef] [Google Scholar]
- Fabj, G., Dittmann, A. J., Cantiello, M., Perna, R., & Samsing, J. 2025, ApJ, 981, 16 [Google Scholar]
- Fan, X., Bañados, E., & Simcoe, R. A. 2023, ARA&A, 61, 373 [NASA ADS] [CrossRef] [Google Scholar]
- Ferrara, A., Salvadori, S., Yue, B., & Schleicher, D. 2014, MNRAS, 443, 2410 [NASA ADS] [CrossRef] [Google Scholar]
- Fishlock, C. K., Karakas, A. I., Lugaro, M., & Yong, D. 2014, ApJ, 797, 44 [Google Scholar]
- Fujii, M. S., Wang, L., Tanikawa, A., Hirai, Y., & Saitoh, T. R. 2024, Science, 384, 1488 [NASA ADS] [CrossRef] [Google Scholar]
- Garcia, F. A. B., Ricotti, M., & Sugimura, K. 2025, arXiv e-prints [arXiv:2503.08779] [Google Scholar]
- Giersz, M., Leigh, N., Hypki, A., Lützgendorf, N., & Askar, A. 2015, MNRAS, 454, 3150 [Google Scholar]
- Gilli, R., Calura, F., D’Ercole, A., & Norman, C. 2017, A&A, 603, A69 [NASA ADS] [CrossRef] [EDP Sciences] [Google Scholar]
- Gratton, R., Bragaglia, A., Carretta, E., et al. 2019, A&A Rev., 27, 8 [NASA ADS] [CrossRef] [Google Scholar]
- Häberle, M., Neumayer, N., Seth, A., et al. 2024, Nature, 631, 285 [CrossRef] [Google Scholar]
- Hamann, F., & Ferland, G. 1993, ApJ, 418, 11 [Google Scholar]
- Harikane, Y., Zhang, Y., Nakajima, K., et al. 2023, ApJ, 959, 39 [NASA ADS] [CrossRef] [Google Scholar]
- Iben, Jr., I., & Renzini, A. 1983, ARA&A, 21, 271 [NASA ADS] [CrossRef] [Google Scholar]
- Inayoshi, K., Visbal, E., & Haiman, Z. 2020, ARA&A, 58, 27 [NASA ADS] [CrossRef] [Google Scholar]
- Isobe, Y., Ouchi, M., Tominaga, N., et al. 2023, ApJ, 959, 100 [NASA ADS] [CrossRef] [Google Scholar]
- Isobe, Y., Maiolino, R., D’Eugenio, F., et al. 2025, MNRAS, submitted [arXiv:2502.12091] [Google Scholar]
- Izotov, Y. I., Thuan, T. X., & Guseva, N. G. 2012, A&A, 546, A122 [NASA ADS] [CrossRef] [EDP Sciences] [Google Scholar]
- Izotov, Y. I., Schaerer, D., Worseck, G., et al. 2023, MNRAS, 522, 1228 [NASA ADS] [CrossRef] [Google Scholar]
- Ji, X., Übler, H., Maiolino, R., et al. 2024, MNRAS, 535, 881 [NASA ADS] [CrossRef] [Google Scholar]
- Johnson, C. I., Pilachowski, C. A., Michael Rich, R., & Fulbright, J. P. 2009, ApJ, 698, 2048 [Google Scholar]
- Kacharov, N., Neumayer, N., Seth, A. C., et al. 2018, MNRAS, 480, 1973 [Google Scholar]
- Karakas, A. I. 2010, MNRAS, 403, 1413 [NASA ADS] [CrossRef] [Google Scholar]
- King, I. R., Bedin, L. R., Cassisi, S., et al. 2012, AJ, 144, 5 [NASA ADS] [CrossRef] [Google Scholar]
- Kobayashi, C., & Ferrara, A. 2024, ApJ, 962, L6 [NASA ADS] [CrossRef] [Google Scholar]
- Kroupa, P. 2001, MNRAS, 322, 231 [NASA ADS] [CrossRef] [Google Scholar]
- Lahén, N., Naab, T., Rantala, A., & Partmann, C. 2025, MNRAS, submitted [arXiv:2504.18620] [Google Scholar]
- Larson, R. L., Finkelstein, S. L., Kocevski, D. D., et al. 2023, ApJ, 953, L29 [NASA ADS] [CrossRef] [Google Scholar]
- Latour, M., Kamann, S., Martocchia, S., et al. 2025, A&A, 694, A248 [NASA ADS] [CrossRef] [EDP Sciences] [Google Scholar]
- Lee, Y. W., Joo, J. M., Sohn, Y. J., et al. 1999, Nature, 402, 55 [Google Scholar]
- Legnardi, M. V., Milone, A. P., Armillotta, L., et al. 2022, MNRAS, 513, 735 [NASA ADS] [CrossRef] [Google Scholar]
- Limberg, G., Souza, S. O., Pérez-Villegas, A., et al. 2022, ApJ, 935, 109 [NASA ADS] [CrossRef] [Google Scholar]
- Limongi, M., & Chieffi, A. 2018, ApJS, 237, 13 [NASA ADS] [CrossRef] [Google Scholar]
- Lodato, G., & Natarajan, P. 2006, MNRAS, 371, 1813 [NASA ADS] [CrossRef] [Google Scholar]
- Loeb, A., & Rasio, F. A. 1994, ApJ, 432, 52 [Google Scholar]
- Madau, P., & Rees, M. J. 2001, ApJ, 551, L27 [Google Scholar]
- Madau, P., Haardt, F., & Dotti, M. 2014, ApJ, 784, L38 [NASA ADS] [CrossRef] [Google Scholar]
- Maeder, A., Meynet, G., & Chiappini, C. 2015, A&A, 576, A56 [NASA ADS] [CrossRef] [EDP Sciences] [Google Scholar]
- Maiolino, R., Scholtz, J., Curtis-Lake, E., et al. 2024a, A&A, 691, A145 [NASA ADS] [CrossRef] [EDP Sciences] [Google Scholar]
- Maiolino, R., Scholtz, J., Witstok, J., et al. 2024b, Nature, 627, 59 [NASA ADS] [CrossRef] [Google Scholar]
- Marino, A. F., Milone, A. P., Piotto, G., et al. 2011, ApJ, 731, 64 [Google Scholar]
- Marino, A. F., Milone, A. P., Piotto, G., et al. 2012, ApJ, 746, 14 [CrossRef] [Google Scholar]
- Marino, A. F., Milone, A. P., Renzini, A., et al. 2019, MNRAS, 487, 3815 [CrossRef] [Google Scholar]
- Marques-Chaves, R., Schaerer, D., Kuruvanthodi, A., et al. 2024, A&A, 681, A30 [NASA ADS] [CrossRef] [EDP Sciences] [Google Scholar]
- Milone, A. P., & Marino, A. F. 2022, Universe, 8, 359 [NASA ADS] [CrossRef] [Google Scholar]
- Milone, A. P., Piotto, G., Renzini, A., et al. 2017, MNRAS, 464, 3636 [Google Scholar]
- Muratov, A. L., Gnedin, O. Y., Gnedin, N. Y., & Zemp, M. 2013, ApJ, 773, 19 [Google Scholar]
- Nagele, C., & Umeda, H. 2023, ApJ, 949, L16 [NASA ADS] [CrossRef] [Google Scholar]
- Nandal, D., Sibony, Y., & Tsiatsiou, S. 2024, A&A, 688, A142 [NASA ADS] [CrossRef] [EDP Sciences] [Google Scholar]
- Nandal, D., Whalen, D. J., Latif, M. A., & Heger, A. 2025, Science, submitted [arXiv:2502.04435] [Google Scholar]
- Napolitano, L., Castellano, M., Pentericci, L., et al. 2024, ApJ, accepted [arXiv:2410.18763] [Google Scholar]
- Neumayer, N., Seth, A., & Böker, T. 2020, A&A Rev., 28, 4 [NASA ADS] [CrossRef] [Google Scholar]
- Pascale, M., Dai, L., McKee, C. F., & Tsang, B. T. H. 2023, ApJ, 957, 77 [NASA ADS] [CrossRef] [Google Scholar]
- Pfeffer, J., Lardo, C., Bastian, N., Saracino, S., & Kamann, S. 2021, MNRAS, 500, 2514 [Google Scholar]
- Piotto, G., Bedin, L. R., Anderson, J., et al. 2007, ApJ, 661, L53 [NASA ADS] [CrossRef] [Google Scholar]
- Portegies Zwart, S. F., & McMillan, S. L. W. 2002, ApJ, 576, 899 [Google Scholar]
- Renzini, A. 2023, MNRAS, 525, L117 [NASA ADS] [CrossRef] [Google Scholar]
- Rizzuti, F., Matteucci, F., Molaro, P., Cescutti, G., & Maiolino, R. 2025, A&A, 697, A96 [NASA ADS] [CrossRef] [EDP Sciences] [Google Scholar]
- Rossi, M., Romano, D., Mucciarelli, A., et al. 2024, A&A, 691, A284 [NASA ADS] [CrossRef] [EDP Sciences] [Google Scholar]
- Schaerer, D., Marques-Chaves, R., Xiao, M., & Korber, D. 2024, A&A, 687, L11 [NASA ADS] [CrossRef] [EDP Sciences] [Google Scholar]
- Schneider, R., Valiante, R., Trinca, A., et al. 2023, MNRAS, 526, 3250 [NASA ADS] [CrossRef] [Google Scholar]
- Senchyna, P., Plat, A., Stark, D. P., et al. 2024, ApJ, 966, 92 [NASA ADS] [CrossRef] [Google Scholar]
- Syer, D., Clarke, C. J., & Rees, M. J. 1991, MNRAS, 250, 505 [NASA ADS] [CrossRef] [Google Scholar]
- Tacchella, S., Eisenstein, D. J., Hainline, K., et al. 2023, ApJ, 952, 74 [NASA ADS] [CrossRef] [Google Scholar]
- Tailo, M., Di Criscienzo, M., D’Antona, F., Caloi, V., & Ventura, P. 2016, MNRAS, 457, 4525 [CrossRef] [Google Scholar]
- Trinca, A., Schneider, R., Maiolino, R., et al. 2023, MNRAS, 519, 4753 [NASA ADS] [CrossRef] [Google Scholar]
- Trinca, A., Valiante, R., Schneider, R., et al. 2024, A&A, submitted [arXiv:2412.14248] [Google Scholar]
- Übler, H., Maiolino, R., Curtis-Lake, E., et al. 2023, A&A, 677, A145 [NASA ADS] [CrossRef] [EDP Sciences] [Google Scholar]
- Vanzella, E., Claeyssens, A., Welch, B., et al. 2023, ApJ, 945, 53 [NASA ADS] [CrossRef] [Google Scholar]
- Ventura, P., & D’Antona, F. 2005a, A&A, 431, 279 [NASA ADS] [CrossRef] [EDP Sciences] [Google Scholar]
- Ventura, P., & D’Antona, F. 2005b, A&A, 439, 1075 [NASA ADS] [CrossRef] [EDP Sciences] [Google Scholar]
- Ventura, P., D’Antona, F., Mazzitelli, I., & Gratton, R. 2001, ApJ, 550, L65 [CrossRef] [Google Scholar]
- Ventura, P., Di Criscienzo, M., Carini, R., & D’Antona, F. 2013, MNRAS, 431, 3642 [Google Scholar]
- Vincenzo, F., Belfiore, F., Maiolino, R., Matteucci, F., & Ventura, P. 2016, MNRAS, 458, 3466 [NASA ADS] [CrossRef] [Google Scholar]
- Vink, J. S. 2023, A&A, 679, L9 [NASA ADS] [CrossRef] [EDP Sciences] [Google Scholar]
- Volonteri, M. 2010, A&A Rev., 18, 279 [NASA ADS] [CrossRef] [Google Scholar]
- Volonteri, M., Silk, J., & Dubus, G. 2015, ApJ, 804, 148 [Google Scholar]
- Volonteri, M., Habouzit, M., & Colpi, M. 2021, Nat. Rev. Phys., 3, 732 [NASA ADS] [CrossRef] [Google Scholar]
- Walcher, C. J., van der Marel, R. P., McLaughlin, D., et al. 2005, ApJ, 618, 237 [NASA ADS] [CrossRef] [Google Scholar]
- Wang, J.-M., Liu, J.-R., Ho, L. C., Li, Y.-R., &Du, P. 2021, ApJ, 916, L17 [Google Scholar]
We include CEERS 1019 in the list of AGN-hosting galaxies, based on the results by Larson et al. (2023) who find that the Hβ line emission contains a broad component, fitted with a very high rotation velocity, sign of the presence of an AGN Broad Line Region. According to Marques-Chaves et al. (2024) this is a very young star-forming galaxy hiding no SMBH.
It is important here to clarify that the evolution of massive AGBs was drastically revised in the latest 20 years starting with the studies by Ventura et al. (2001) and the following works, notably by Ventura & D’Antona (2005a,b); Ventura et al. (2013), and we are specifically dealing with this kind of results. When authors are led to reject the role of AGBs in the evolution of these systems, based on previous modelling, their result must be analysed with care when they adopted very different yields (see, e.g. the results of Isobe et al. 2023, based on the evolution model by Hamann & Ferland 1993).
In the models displayed here it is α/Fe=0.4 for Z≤0.002, and α/Fe=0.2 for Z=0.004 and 0.008.
D’Antona et al. (2011) interpreted these data on the basis of D’Ercole et al. (2008) model, showing that the direct correlation O–Na in the high metallicity bins was expected if in the last phases of star formation the whole populations were made by undiluted AGB winds of different evolving mass.
Again, the stars with the lowest metallicities have only modest helium enhancements.
All Tables
All Figures
|
Fig. 1 Abundances in GN-z11, GHz9, CEERS 1019, and GS_3073 compared with models. Panel a: diagram log(N/O) vs. log(O/H)+12. For GN-z11 and CEERS 1019, we show the standard locations in the literature and the locations based on models by Isobe et al. (2023) including the AGN radiation (see Table 1); for GS_3073 we show the fiducial (red pentagon) and lower limit (grey triangle) derived from the UV-dense lines, monitoring the region closest to the AGN, while the log(N/O) from optical lines are the red square (without outflow) and the reverse grey triangle (with outflow). The colour scale on the right defines the metallicity of the different sets of mass-averaged ejecta composition (triangles) for initial AGB masses from 7.5 to 3 M⊙- or 2.5 M⊙ in one case from the models by Ventura et al. (2013). The metal mass fractions of the tracks Z and the corresponding [Fe/H] are Z=0.0003 ([Fe/H]=–2), 0.001 (–1.5), 0.002 (–1.2), 0.004 (–0.75), and 0.008 (–0.45). A few masses are also labelled as reference. The yellow band shows the reference location of ejecta dominated by hot bottom burning as a function of log(O/H). Stars represent the initial O/H and N/O abundances of the models. The solar symbol is placed at the values corresponding to solar abundances. At the bottom we show the upper (full line) and lower (dashed line) envelope of the chemical evolution models by Vincenzo et al. (2016). Panel b: diagram log(C/O) vs. log(O/H)+12. The symbols and lines are the same as in panel a. |
| In the text | |
|
Fig. 2 Abundances (triangles) in the plane log(N/O) vs. log(O/H)+12 for a sample of ω Cen giants by Marino et al. (2012) for [Fe/H] according to the scale at the right. The abundances in GN-z11, GHz9, CEERS 1019, and GH3073 are displayed as in Fig.1. The yellow diagonal strip represents the locus of pure AGB ejecta of intermediate masses for a wide range of metallicities defined by the models shown in Fig. 1. The stars symbols show the initial abundances of the evolved models, and the diamonds on the strip represent the ejecta of 5 M⊙ of the different sets of tracks. |
| In the text | |
|
Fig. 3 Range of lower limits for log(Fe/O) for GS_3073 compared with the model ejecta values for the different sets of metallicities from Z=0.0003 (lower line) to Z=0.004 (upper line). |
| In the text | |
|
Fig. 4 Comparison of the abundance of ejecta as a function of the mass for [Fe/H]=–1.2 and –1.5. The fiducial abundance regions for GS_3073 are the green strips, while the green dot-dashed line represents the lowest possible abundance for log(C/O). The evolving masses which best reproduce the fiducial abundances of the UV dense region close to the SMBH are ~4-3.5 M⊙, for Z=0.001 and 4-3 M⊙ for Z=0.002. |
| In the text | |
|
Fig. 5 Schematic view of the growth of the seed BH through the GN-z11 and GS_3073 masses up to the masses at z=6–7 (Inayoshi et al. 2020). The black squares show the BH masses versus the age of the Universe corresponding to the redshifts of the four systems in Table 1. We fix the zero age of the NSC formation at z=19.5 and age of the Universe of ~200 Myr. The initial masses for the BH evolution are in the range allowed for stellar BH remnants (in this plot 30 M⊙), and we assume dynamical merging to form a 1000 M⊙ seed during the first 30 Myr after their formation (dynamical evolution is represented by the red dotted line). We plot the systems GN-z11 and GS_3073 as red squares at the ages found in this work (plus the 200 Myr of the zero point of ages), based on the N/O and C/O versus O/H abundances of GS_3073, and on the idea that they correspond to pure AGB ejecta, in a NSC system evolution resembling ω Cen. GN-z11 is obviously very close to its redshift age, while the horizontal arrow shows the shift to the growing-age location of GS_3073. The accretion evolution is represented by the yellow band. The lines connecting the 1000 M⊙ seed and the average locations of GN-z11, GS_3073 and the quasars at z=6–7 give a qualitative idea of the mass growing rates. The slope for constant accretion rates equal to α times the Eddington mass accretion, with α=0.2, 1, 1.4 and 2 are shown for a qualitative comparison with the slope of the segments connecting the objects. The dotted green line extrapolates back in time the line α ≃ 1.4 connecting the locations of GN-z11 and GS_3073, and shows that an initial seed of ~104 M⊙ needs a uniform super-Eddington rate till the mass of GS_3073. |
| In the text | |
Current usage metrics show cumulative count of Article Views (full-text article views including HTML views, PDF and ePub downloads, according to the available data) and Abstracts Views on Vision4Press platform.
Data correspond to usage on the plateform after 2015. The current usage metrics is available 48-96 hours after online publication and is updated daily on week days.
Initial download of the metrics may take a while.