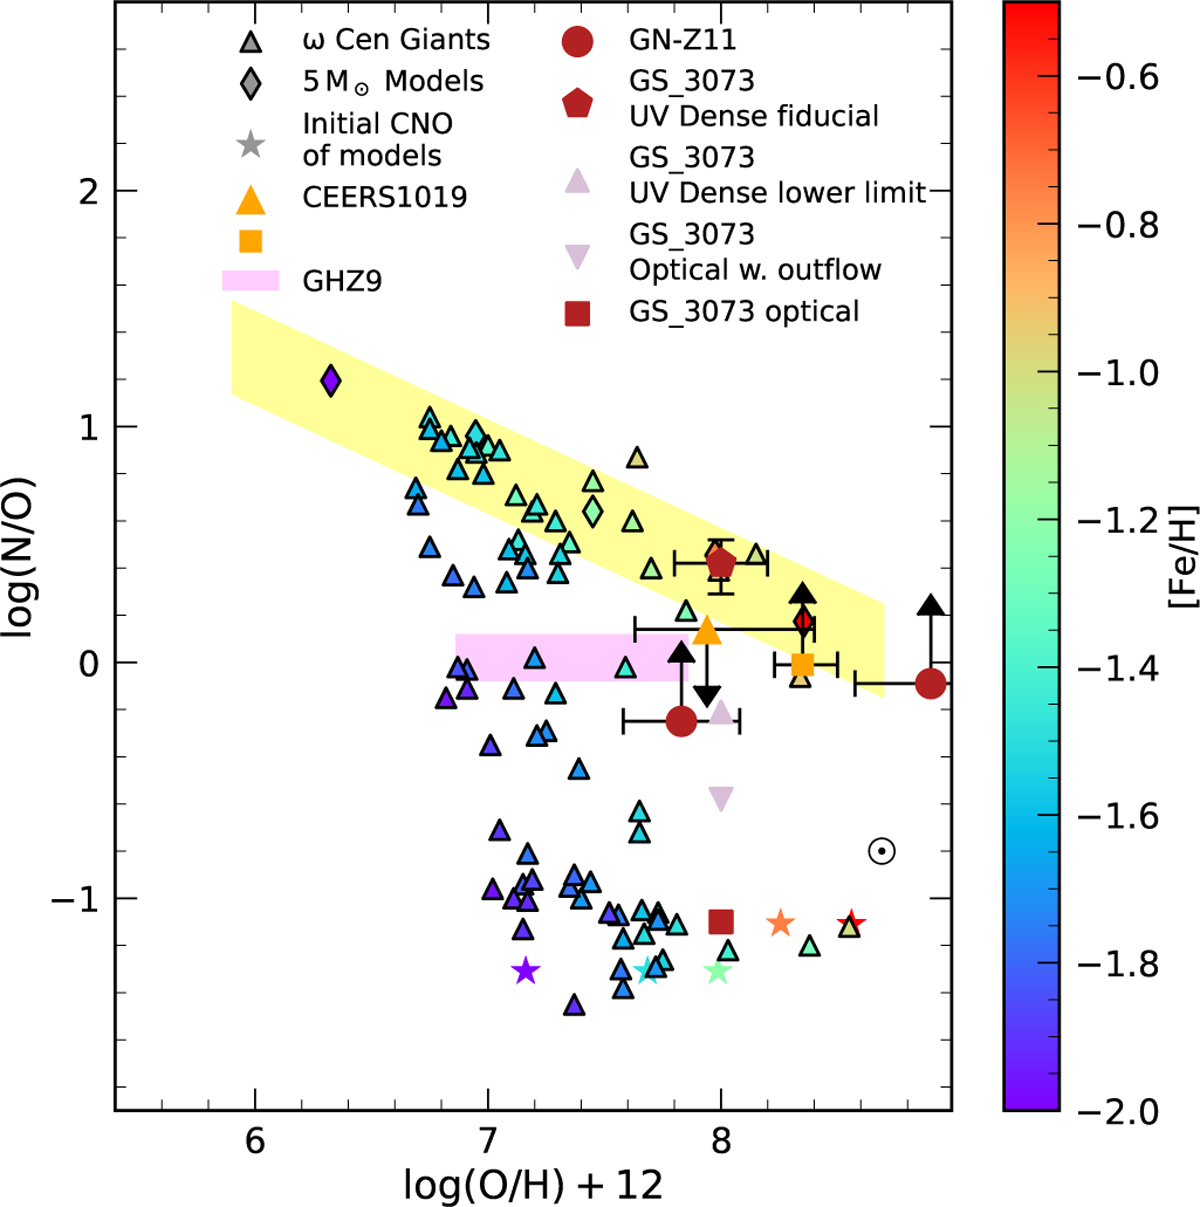
Fig. 2
Download original image
Abundances (triangles) in the plane log(N/O) vs. log(O/H)+12 for a sample of ω Cen giants by Marino et al. (2012) for [Fe/H] according to the scale at the right. The abundances in GN-z11, GHz9, CEERS 1019, and GH3073 are displayed as in Fig.1. The yellow diagonal strip represents the locus of pure AGB ejecta of intermediate masses for a wide range of metallicities defined by the models shown in Fig. 1. The stars symbols show the initial abundances of the evolved models, and the diamonds on the strip represent the ejecta of 5 M⊙ of the different sets of tracks.
Current usage metrics show cumulative count of Article Views (full-text article views including HTML views, PDF and ePub downloads, according to the available data) and Abstracts Views on Vision4Press platform.
Data correspond to usage on the plateform after 2015. The current usage metrics is available 48-96 hours after online publication and is updated daily on week days.
Initial download of the metrics may take a while.