Fig. 4
Download original image
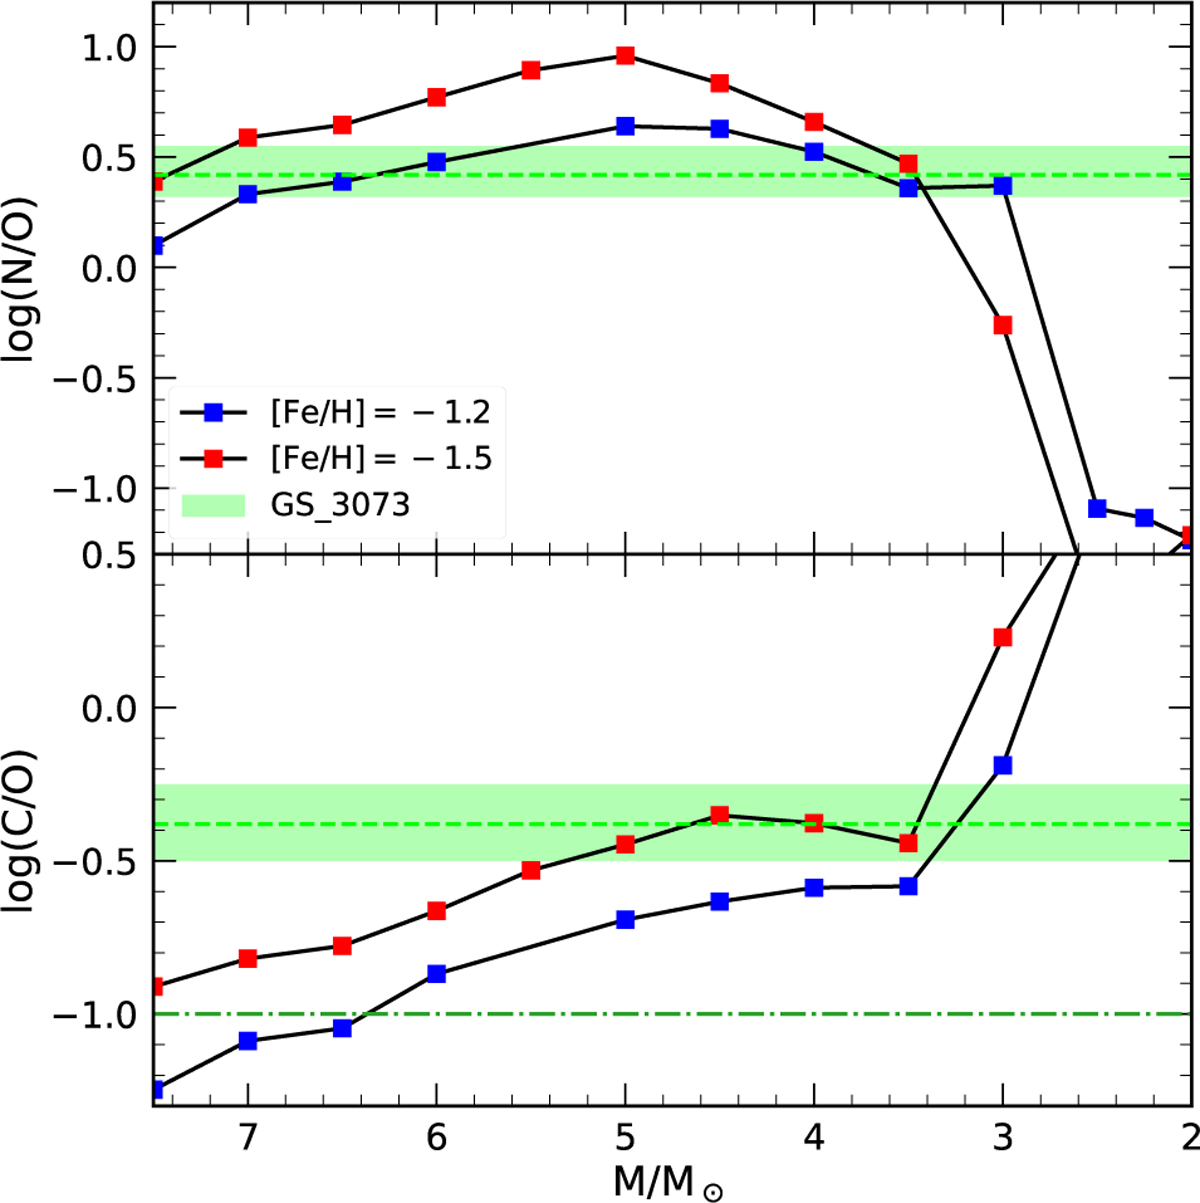
Comparison of the abundance of ejecta as a function of the mass for [Fe/H]=–1.2 and –1.5. The fiducial abundance regions for GS_3073 are the green strips, while the green dot-dashed line represents the lowest possible abundance for log(C/O). The evolving masses which best reproduce the fiducial abundances of the UV dense region close to the SMBH are ~4-3.5 M⊙, for Z=0.001 and 4-3 M⊙ for Z=0.002.
Current usage metrics show cumulative count of Article Views (full-text article views including HTML views, PDF and ePub downloads, according to the available data) and Abstracts Views on Vision4Press platform.
Data correspond to usage on the plateform after 2015. The current usage metrics is available 48-96 hours after online publication and is updated daily on week days.
Initial download of the metrics may take a while.