Fig. 1.
Download original image
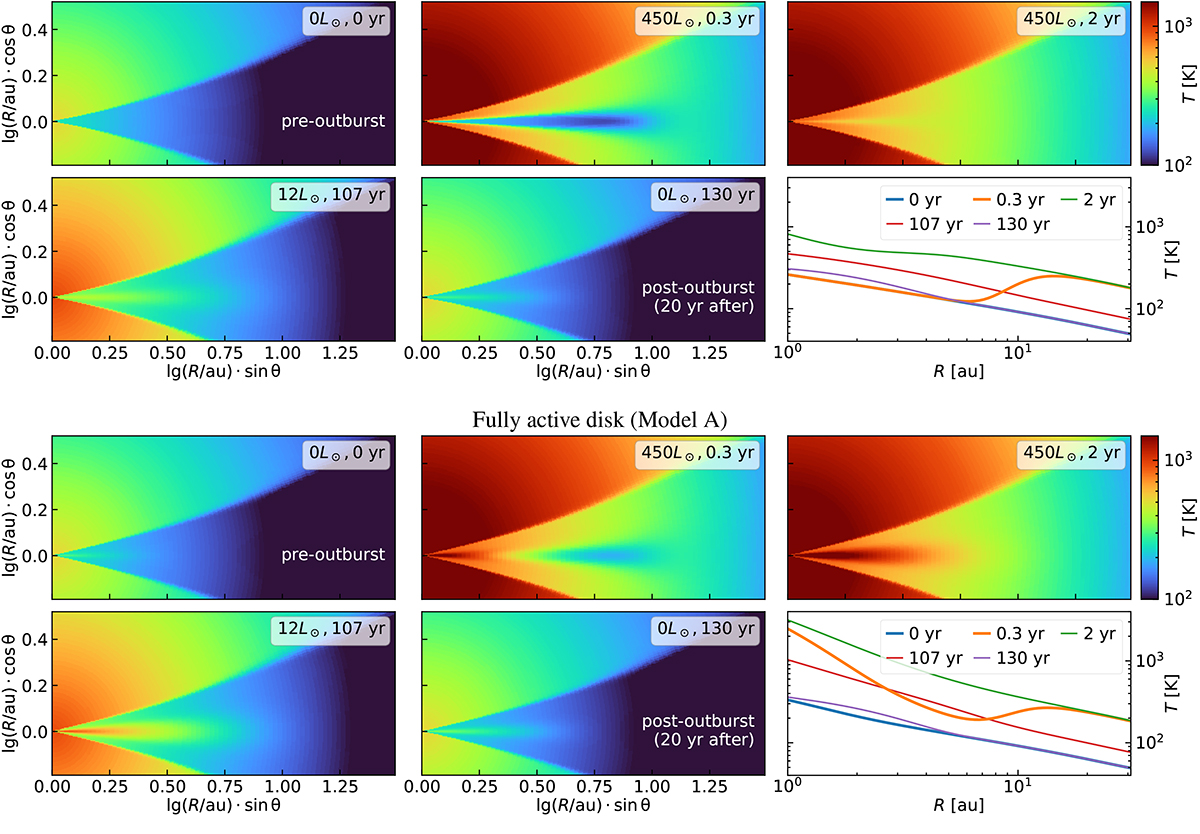
Evolution of the disk thermal structure during the outburst for the passive outer disk model (Model P; upper set of panels) and the fully active disk model (Model A; lower set of panels). Each panel set shows a selection of time moments; the total outburst energetics are shown in the legend of each panel. The lower right panel in each set presents the midplane temperature radial profile for the same time moments. The chosen coordinates for the heatmaps lg(R/au)sinθ − lg(R/au)cosθ allow us to highlight the inner and midplane regions and are convenient for representing data obtained on the polar (R, θ) grid.
Current usage metrics show cumulative count of Article Views (full-text article views including HTML views, PDF and ePub downloads, according to the available data) and Abstracts Views on Vision4Press platform.
Data correspond to usage on the plateform after 2015. The current usage metrics is available 48-96 hours after online publication and is updated daily on week days.
Initial download of the metrics may take a while.