| Issue |
A&A
Volume 700, August 2025
|
|
|---|---|---|
| Article Number | L24 | |
| Number of page(s) | 8 | |
| Section | Letters to the Editor | |
| DOI | https://doi.org/10.1051/0004-6361/202554962 | |
| Published online | 28 August 2025 | |
Letter to the Editor
Time-dependent response of protoplanetary disk temperature to an FU Ori-type luminosity outburst
1
Saint Petersburg State University, Universitetskij Pr. 28, St. Petersburg, 198504
Russia
2
Institute of Astronomy, Russian Academy of Sciences, Pyatnitskaya Str. 48, Moscow, 119017
Russia
3
Main Astronomical Observatory at Pulkovo, Pulkovskoe Sh. 65/1, St. Petersburg, 196140
Russia
4
Konkoly Observatory, HUN-REN Research Centre for Astronomy and Earth Sciences, MTA Centre of Excellence, Konkoly-Thege Miklós út 15-17, 1121
Budapest, Hungary
5
Institute of Physics and Astronomy, ELTE Eötvös Loránd University, Pázmány Péter Sétány 1/A, 1117
Budapest, Hungary
6
Max-Planck-Insitut für Astronomie, Königstuhl 17, 69117
Heidelberg, Germany
7
Department of Astrophysics, Türkenschanzstraße 17, 1180
Vienna, Austria
⋆ Corresponding author: This email address is being protected from spambots. You need JavaScript enabled to view it.
Received:
1
April
2025
Accepted:
2
August
2025
Abstract
Context. The most prominent cases of young star variability are accretion outbursts in FU Ori-type systems. The high power of such outbursts causes dramatic changes in the physical and chemical structure of a surrounding protoplanetary disk. As characteristic thermal timescales in the disk are comparable to the duration of the outburst, the response of its thermal structure is inherently time dependent.
Aims. We analyzed how the disk thermal structure evolves under the substantial–yet transient–heating of the outburst. To cover different possible physical mechanisms driving the outburst, we examined two scenarios: one in which the increased accretion rate is confined to a compact sub-au inner region and the other where it affects the entire disk.
Methods. To model the disk temperature response to the outburst we performed time-dependent radiation transfer using the HURAKAN code. The disk structure and the luminosity profile roughly correspond to those of the FU Ori system itself, which went into outburst about 90 years ago and reached a luminosity of 450 L⊙. The static RADMC-3D code was used to model synthetic spectral energy distributions (SEDs) of the disk based on the temperatures calculated with HURAKAN.
Results. We find that optically thick disk regions require several years to become fully heated during the outburst and a decade to cool after it. The upper layers and outer parts of the disk, which are optically thin to thermal radiation, are heated and cooled almost instantaneously. This creates an unusual radial temperature profile during the early heating phase with minima at several au both for the fully active and compact active disk scenarios. At the cooling phase, an unusual temperature gradient occurs in the vertical direction with the upper layers being colder than the midplane for both scenarios. Near- and mid-infrared SEDs demonstrate a significant and almost instantaneous rise by 1 − 2 orders of magnitude during the outburst, while the millimeter flux shows a change of only a factor of a few, and is slightly delayed with respect to the central region luminosity profile.
Key words: accretion / accretion disks / radiative transfer / protoplanetary disks / stars: pre-main sequence / stars: variables: T Tauri / Herbig Ae/Be
© The Authors 2025
 Open Access article, published by EDP Sciences, under the terms of the Creative Commons Attribution License (https://creativecommons.org/licenses/by/4.0), which permits unrestricted use, distribution, and reproduction in any medium, provided the original work is properly cited.
This article is published in open access under the Subscribe to Open model. This email address is being protected from spambots. You need JavaScript enabled to view it. to support open access publication.
1. Introduction
FU Orionis-type luminosity outbursts are associated with a sudden increase in protostellar disk accretion (Hartmann & Kenyon 1996; Fischer et al. 2023). Although the outburst-triggering mechanism remains unclear (Vorobyov et al. 2021; Nayakshin & Elbakyan 2024), the observed phenomena are thought to originate primarily in the inner active accretion disk, which is confined to within a few tenths of an au. Models of the active disk, incorporating complex physical processes, are rapidly advancing (e.g., Zhu et al. 2009, 2020; Steiner et al. 2021; Cecil & Flock 2024). Recent observations from far-UV to centimeter wavelengths provide new valuable constraints on these models (Liu et al. 2017, 2019; Lykou et al. 2022; Carvalho et al. 2024). The physics of outer disk regions are also studied in different aspects (e.g., Alarcón et al. 2024; Cecil et al. 2024; Hales et al. 2024; Zurlo et al. 2024).
Luminosity outbursts of FU Ori-type systems should have a profound impact on the physical and chemical structure of their protoplanetary disks. For a typical outburst duration and magnitude (∼10 yr and ∼100 L⊙, respectively; Fischer et al. 2023), the energy released in the inner active disk may significantly exceed the total disk thermal energy at the pre-outburst stage. In addition to significant restructuring of the inner active disk, its strong UV/optical radiation should cause profound changes in the thermal structure of the outer passive disk. The heating process is intrinsically time dependent: different parts of the passive disk are heated on different timescales as radiation diffuses toward the optically thick midplane. Similarly, when the central source luminosity drops back to normal, the disk cools nonhomogeneously with optically thick parts shedding excess energy on timescales comparable with those of observational monitoring programs.
The time-dependent nature of disk heating and cooling is currently poorly understood, and many popular radiation transfer codes for protoplanetary disks treat the process statically, i.e. assuming instantaneous adaptation of the disk temperature to the central region luminosity. Among the notable exceptions is the recent study by Wolf et al. (2024), where a time-dependent Monte Carlo radiation transfer code was used to model an accretion burst in a massive young stellar object. Another example is the work by Schneider et al. (2018), who used a radiation-hydrodynamics code to compute the time-dependent behavior of an axisymmetric disk structure and found that an outburst can produce circular surface waves of considerable amplitude that manifest themselves in scattered light images as bright and dark concentric rings.
The time-dependent nature of the heat propagation in nonequilibrium conditions may lead to peculiar features not seen in static radiation transfer. Among them are the apparent discrepancy between the central source luminosity and disk temperature; unusual vertical and radial temperature gradients; and a time lag or full de-correlation between optical, infrared, and millimeter variability. As this behavior can be linked to observational phenomena such as temporal change in maser spots location (Burns et al. 2020) or changing variability patterns with wavelength (Frimann et al. 2017; Johnstone et al. 2018; Wendeborn et al. 2020; Contreras Peña et al. 2020), it is important to study the effects of time-dependent radiation transfer (TDRT) to disentangle them from other potential explanations.
The disk chemical evolution during an outburst event is a much better explored topic both theoretically and observationally. The major driver of chemical changes during the outburst is the sublimation of volatile species from dust grains, which leads to an increase in their gas-phase abundances by several orders of magnitude (Banzatti et al. 2012; Visser et al. 2015; Taquet et al. 2016; Rab et al. 2017; Molyarova et al. 2018; Wiebe et al. 2019; Zwicky et al. 2024). Some complex organic molecules were first detected in protoplanetary disks in outbursting sources, specifically (Lee et al. 2019), while molecule-rich spectra in currently quiet objects are supposed to be a signature feature of recently finished outburst activity (Zwicky et al. 2024; Calahan et al. 2024).
In the theoretical studies of outburst impact on the physical and chemical structure of the disk, the temperature is often assumed to adapt instantaneously to the luminosity changes. In cases with low optical depths to the thermal radiation this approach is well justified (Johnstone et al. 2013), while for dense regions of protoplanetary disks the assumption may not hold. In the work by Wolf et al. (2024), closest to our paper, the TDRT was used to estimate the burst energetics without going into the details of the temperature distribution evolution. In addition, the outburst energetics and parameters of their object of interest (a massive young stellar object) differ greatly from those we consider in this Letter. In the following sections, we study the time-dependent response of a protoplanetary disk to a 450 L⊙ luminosity outburst event and focus both on the disk thermal evolution and potential observational manifestation.
2. Physical model and methods
2.1. Time-dependent radiation transfer
To calculate the thermal evolution of the disk we used the nonstationary FLDs method from Pavlyuchenkov (2024) implemented in the numerical code HURAKAN (Pavlyuchenkov et al. 2022). In this method the radiation field is split into stellar and dust thermal radiation. The heating by the stellar (central source) radiation is calculated using the frequency-dependent ray tracing method, while the diffusion approximation with a flux limiter (FLD approach) and the mean opacities are used to treat the propagation of the thermal radiation. Internal nonradiative heating such as viscous dissipation is also included via the source term. More details on the method, utilized opacities, and benchmarking are provided in Appendix A.
The simulations are performed in 2D on a nonuniform polar (R, θ) spatial grid with 200 radial and 200 angular cells. To trace density gradients, the radial grid is logarithmic and the polar grid is more condensed in the regions containing the bulk of the disk mass (75° < θ < 105°). The inner and outer radial grid boundaries are 0.03 and 250 au, the polar grid covers [0, π].
2.2. Disk structure
The radial disk structure is set by the gas surface density profile, which has two exponential cutoffs at the inner and outer characteristic radii, Rin and Rout:
![Mathematical equation: $$ \begin{aligned} \Sigma _{\rm g}(R) = \Sigma _0 \left(\frac{R}{R_{\rm out}}\right)^{-\gamma } \exp \left[-\left(\frac{R}{R_{\rm out}}\right)^{2-\gamma }\right] \exp \left[-\left(\frac{R}{R_{\rm in}}\right)^{\gamma -2} \right]. \end{aligned} $$](/articles/aa/full_html/2025/08/aa54962-25/aa54962-25-eq1.gif) (1)
(1)
The inner cutoff at Rin = 1 au allows us to suppress disk self-shadowing by the inner wall. The values for the outer characteristic radius, disk, and stellar masses are set to roughly represent the FU Ori system itself (Rout = 11 au, Mdisk = 6.6 × 10⁻³ M⊙, M⋆ = 0.6 M⊙; Pérez et al. 2020). The assumed power law index γ = 1 can be associated with a viscously evolving disk heated by central source radiation, resulting in a temperature profile T ∝ R−0.5 in the blackbody case.
Given the surface density, we calculate the volume density distribution in the meridional plane assuming the disk to be in hydrostatic equilibrium in the vertical direction. The temperature and vertical density profiles are iterated with each other to find pre-outburst stationary structure. After such initial temperature–density iterations, the density distribution is fixed for the outburst and post-outburst thermal relaxation. While the gas density is likely affected by the luminosity outburst as well, in this Letter we focus purely on disk thermal evolution. Understanding the time-dependent temperature evolution on a fixed density structure is crucial for future studies of the coupled thermal and hydrodynamical disk response.
In our model, the central source luminosity Lν is the sum of two blackbody components representing the intrinsic stellar and accretion-induced radiation:
 (2)
(2)
The stellar component is not evolving (R⋆ = 3.6 R⊙, T⋆ = 4000 K, L⋆ = 3 L⊙; Baraffe et al. 2015), while the accretion source with effective temperature Tacc = 104 K is variable according to a prescribed outburst luminosity curve  .
.
The physical mechanism(s) behind the FU Ori outburst events is a matter of debate. To cover a range of possibilities we consider two models depending on where the sudden accretion rate increase is confined: within the innermost active disk on sub-au scales with the outer disk beyond 1 au being stable or when the whole radial disk extent is affected by accretion rate jump. In the first model, which we refer to as the passive outer disk model or Model P, the whole outburst energy, which we set to 450 L⊙ at maximum, is released in the star vicinity and affects the outer disk only via the UV/optical radiation. In the second fully active disk model (Model A), we assume that the whole disk experiences an instantaneous increase in accretion rate Ṁ from a background value of 2 × 10⁻⁸ M⊙ yr−1 to a much higher rate, which is constant over the disk. The viscous heat is fully neglected in Model P to make the comparison between the models clearer.
Most of the heating of the outer disk in Model A is still caused by the strong UV/optical radiation from the inner regions of the active disk inside some radius RA. The outer regions of the active disk (beyond RA) are heated both viscously and radiatively. Separating the active disk into two parts allows us to elaborate a procedure keeping the total outburst energetics the same between the models allowing their direct comparison (see Appendix B for details). For our assumed value of RA = 0.1 au, the total outburst energetics at maximum in Model A (450 L⊙) is split into the radiative part of 412 L⊙ and the viscous part of 38 L⊙ released directly in the disk.
3. Results
The energy radiated during the FU Ori type outburst greatly exceeds the total disk thermal energy at the pre-outburst stage. It still takes time for the radiative flux to diffuse toward the dense disk midplane and be converted to gas thermal energy. Local energy dissipation such as viscous heating takes time as well because of nonzero gas heat capacity and the finite timescales required to equilibrate the thermal radiation field in optically thick conditions. As a consequence, one may expect nonhomogeneous disk temperature evolution during the outburst in both the radial and vertical directions. To characterize this evolution we consider time-dependent radiation transfer using the HURAKAN code for two models described above: the passive outer disk (Model P) and the fully active disk (Model A).
At the pre-outburst state, we run the simulations for 104 yr to get a quasi-stationary structure corresponding to the stellar luminosity L⋆ = 3 L⊙. At t = 0 the radiative accretion source  is initiated for Model P. For Model A, the corresponding value of
  is smaller (412 L⊙; see Equation B.3) as the rest is deposited via viscous heating with the total power of
  corresponding to Ṁ = 9×10⁻⁵ M⊙ yr−1 (Equation B.4). These values are linearly scaled from their maximum values to zero in 110 years. Although the actual luminosity decline may deviate from a linear temporal dependence and vary between objects, we adopt this basic case for simplicity. The profiles for
  and their comparison with the observational data for FU Ori are shown in Fig. A.1.
The 2D temperature distributions for a set of time moments catching pre-outburst (t = 0), early (0.3 and 2 yr), late (107 yr), and post-outburst (130 yr) stages are shown in Fig. 1. For Model P, shown in the upper set of snapshots, one can see that the sudden rise in the central source luminosity leads to immediate heating of the disk atmosphere, while the disk midplane inside 10 au is almost unaffected. At the next time moment of t = 2 yr (right panel in the first row of Fig. 1), when the central source luminosity is still at its highest value, the cool midplane zone shrinks in both radial and vertical extents. This zone is fully heated only after t = 5 yr, when the accretion luminosity already starts to drop (not shown in these panels), which corresponds to the characteristic timescales shown in Fig. C.1. As the accretion luminosity declines during later outburst stages (left panel, second row of Fig. 1,  yr), the same physical mechanism, where optically thin regions adapt more quickly to luminosity changes, produces the inverse temperature distribution. The disk midplane keeps the heat for a decade after the end of the outburst, and is thus hotter than the upper and outer disk parts. The right panel of the second row summarizes the evolution of the temperature profile in radial direction in the midplane.
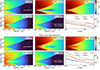 |
Fig. 1. Evolution of the disk thermal structure during the outburst for the passive outer disk model (Model P; upper set of panels) and the fully active disk model (Model A; lower set of panels). Each panel set shows a selection of time moments; the total outburst energetics are shown in the legend of each panel. The lower right panel in each set presents the midplane temperature radial profile for the same time moments. The chosen coordinates for the heatmaps lg(R/au)sinθ − lg(R/au)cosθ allow us to highlight the inner and midplane regions and are convenient for representing data obtained on the polar (R, θ) grid. |
In the fully active disk (Model A), the viscous dissipation produces an overheated midplane region inside several au. At 0.3 yr, the radial temperature profile exhibits a minimum at a location similar to that in Model P. Later, at 2 yr the viscously heated zone spreads outward and engulfs the underheated region. This peculiarity in the thermal structure may have consequences for the disk chemistry during early months of outburst monitoring. Later and post-outburst stages of Model A are qualitatively similar to those of Model P with the disk midplane slowly releasing the heat accumulated during the intense heating phase.
To study possible observable effects, we calculate the corresponding SED evolution using RADMC-3D code (Dullemond et al. 2012), adopting a distance of d = 402 pc (Gaia Collaboration 2023) and a disk inclination of i = 37° (Pérez et al. 2020). As the current version of RADMC-3D does not include time-dependent radiation transfer, we use it only for SED calculations based on the temperature distribution obtained in HURAKAN simulations. As shown in Fig. 2 the SED varies significantly during the outburst. The SED maximum related to the central source radiation moves toward the shorter wavelengths (from 1 to 0.3 μm) during the increase in luminosity. The SED profile between 1 and 10 μm becomes flatter at high luminosities, so the silicate feature at 10 μm becomes less pronounced. The differences between the outer passive disk model and the fully active disk model are also visible. The presence of warmer dust in the midplane of the fully active disk model results in higher fluxes at 1 − 10 μm. In turn, the flux at shorter wavelengths is reduced in Model A due to the lower luminosity of central source. The effect of nonstationary radiative transfer is not very pronounced in the SEDs. The differences between SEDs for time moments t = 0.3 yr and t = 2 yr with the same accretion luminosity of 450 L⋆ and for time moments t = 0 yr and t = 130 yr (before the outburst and 20 years after it) are negligible.
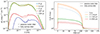 |
Fig. 2. Left panel: Spectral energy distributions for different stages of the outburst. The profiles for Model P and Model A are shown with dashed and solid lines, respectively. Right panel: Evolution of the corresponding radiation fluxes for several wavelengths. The reference ratio |

In the right panel of Fig. 2 we also show the evolution of the normalized total fluxes Fν(t)/Fν(0) calculated for three wavelengths λ = 4.6, 100, 850 μm. As one can see, the fluxes follow the shape of the normalized accretion luminosity curve, but with different scale factors. The flux increase at 4.6 μm is higher than the increase in total luminosity. In turn, the flux increase at λ = 100 and 850 μm is much lower than the total luminosity raise. It should be noted that only a fraction of the radiative heat is intercepted by the disk (typically, 35−40%), but all the dissipative heat goes to the disk. While the total (radiative plus dissipative) outburst energetics is the same for the two models, the total energy deposited to the disk is smaller in Model P than in Model A because of a higher amount of radiation in Model P freely escaping the system through polar regions. This explains why the IR fluxes for Model P are slightly lower than for Model A, as shown in the right panel of Fig. 2.
The effects of nonstationary radiation transfer is mostly hidden in the dust continuum observations as the regions with time-dependent temperature anomalies are in the optically thick regions to disk thermal radiation. The nonstationary effects are only noticeable at (sub-)millimeter wavelengths for a decade after the end of the outburst (between 110 and 125 yr).
4. Conclusions
Using the time-dependent radiative transfer, we considered the impact of an FU Ori type luminosity outburst on the thermal structure of the protoplanetary disk. To cover possible physical mechanisms driving the outburst, we examined two scenarios: one in which the increased accretion rate is confined to the compact sub-au inner region with the outer disk being fully passive (Model P) and one where the outer disk is fully active (Model A).
We find that the protoplanetary disk heats up and cools down nonuniformly in the radial and vertical directions. Optically thick disk regions in both scenarios require several years to become fully heated during the outburst and a decade to cool after it. The upper layers and outer parts of the disk, which are optically thin to thermal radiation, are heated and cooled almost instantaneously. This creates an unusual radial temperature profile during the early heating phase with a minima at several au for both scenarios. During the cooling phase, an inverse temperature gradient in the vertical direction – with upper layers colder than the midplane – appears even in the passive disk model. The fully active Model A is characterized by a strong dissipative energy source inside several au, which speeds up the midplane heating at early outburst stages.
Models P and A reveal noticeable differences in their SEDs at 1 − 10 μm due to the presence of warmer dust in Model A. As the nonstationary effects are confined to the disk regions that are optically thick to the thermal radiation, these effects are mostly hidden from the dust continuum observations.
The inhomogeneously evolving disk temperature is likely to affect other key aspects of disk physics, including the morphology of snowlines and the ionization structure. Consequently,further investigation of disk chemical evolution under nonequilibrium conditions – along with the corresponding molecular emission signatures – represents a particularly interesting area for future research.
Acknowledgments
The authors are grateful to the reviewer for constructive suggestions that helped us to improve the content of the paper. This work was also supported by the NKFIH NKKP grant ADVANCED 149943 and the NKFIH Excellence Grant TKP2021-NKTA-64. Project no. 149943 has been implemented with the support provided by the Ministry of Culture and Innovation of Hungary from the National Research, Development and Innovation Fund, financed under the NKKP ADVANCED funding scheme.
References
- Alarcón, F., Casassus, S., Lyra, W., Pérez, S., & Cieza, L. 2024, MNRAS, 527, 9655 [Google Scholar]
- Banzatti, A., Meyer, M. R., Bruderer, S., et al. 2012, ApJ, 745, 90 [NASA ADS] [CrossRef] [Google Scholar]
- Baraffe, I., Homeier, D., Allard, F., & Chabrier, G. 2015, A&A, 577, A42 [NASA ADS] [CrossRef] [EDP Sciences] [Google Scholar]
- Burns, R. A., Sugiyama, K., Hirota, T., et al. 2020, Nat. Astron., 4, 506 [Google Scholar]
- Calahan, J. K., Bergin, E. A., van’t Hoff, M., et al. 2024, ApJ, 975, 170 [NASA ADS] [CrossRef] [Google Scholar]
- Carvalho, A. S., Hillenbrand, L. A., France, K., & Herczeg, G. J. 2024, ApJ, 973, L40 [Google Scholar]
- Cecil, M., & Flock, M. 2024, A&A, 692, A171 [NASA ADS] [CrossRef] [EDP Sciences] [Google Scholar]
- Cecil, M., Gehrig, L., & Steiner, D. 2024, A&A, 687, A136 [NASA ADS] [CrossRef] [EDP Sciences] [Google Scholar]
- Contreras Peña, C., Johnstone, D., Baek, G., et al. 2020, MNRAS, 495, 3614 [Google Scholar]
- Dullemond, C. P., van Zadelhoff, G. J., & Natta, A. 2002, A&A, 389, 464 [NASA ADS] [CrossRef] [EDP Sciences] [Google Scholar]
- Dullemond, C. P., Juhasz, A., Pohl, A., et al. 2012, Astrophysics Source Code Library [record ascl:1202.015] [Google Scholar]
- Fischer, W. J., Hillenbrand, L. A., Herczeg, G. J., et al. 2023, ASP Conf. Ser., 534, 355 [NASA ADS] [Google Scholar]
- Frimann, S., Jørgensen, J. K., Dunham, M. M., et al. 2017, A&A, 602, A120 [NASA ADS] [CrossRef] [EDP Sciences] [Google Scholar]
- Gaia Collaboration (Vallenari, A., et al.) 2023, A&A, 674, A1 [NASA ADS] [CrossRef] [EDP Sciences] [Google Scholar]
- Green, J. D., Hartmann, L., Calvet, N., et al. 2006, ApJ, 648, 1099 [NASA ADS] [CrossRef] [Google Scholar]
- Hales, A. S., Gupta, A., Ruíz-Rodríguez, D., et al. 2024, ApJ, 966, 96 [NASA ADS] [CrossRef] [Google Scholar]
- Hartmann, L., & Kenyon, S. J. 1996, ARA&A, 34, 207 [NASA ADS] [CrossRef] [Google Scholar]
- Hoffleit, D. 1939, Harvard College Observatory Bulletin, 911, 41 [Google Scholar]
- Jayasinghe, T., Kochanek, C. S., Stanek, K. Z., et al. 2018, MNRAS, 477, 3145 [Google Scholar]
- Johnstone, D., Hendricks, B., Herczeg, G. J., & Bruderer, S. 2013, ApJ, 765, 133 [Google Scholar]
- Johnstone, D., Herczeg, G. J., Mairs, S., et al. 2018, ApJ, 854, 31 [Google Scholar]
- Kenyon, S. J., Hartmann, L., & Hewett, R. 1988, ApJ, 325, 231 [NASA ADS] [CrossRef] [Google Scholar]
- Kenyon, S. J., Kolotilov, E. A., Ibragimov, M. A., & Mattei, J. A. 2000, ApJ, 531, 1028 [NASA ADS] [CrossRef] [Google Scholar]
- Kolotilov, E. A., & Petrov, P. P. 1985, Sov. Astron. Lett., 11, 358 [Google Scholar]
- Lee, J.-E., Lee, S., Baek, G., et al. 2019, Nat. Astron., 3, 314 [Google Scholar]
- Levermore, C. D., & Pomraning, G. C. 1981, ApJ, 248, 321 [NASA ADS] [CrossRef] [Google Scholar]
- Liu, H. B., Vorobyov, E. I., Dong, R., et al. 2017, A&A, 602, A19 [NASA ADS] [CrossRef] [EDP Sciences] [Google Scholar]
- Liu, H. B., Mérand, A., Green, J. D., et al. 2019, ApJ, 884, 97 [NASA ADS] [CrossRef] [Google Scholar]
- Lykou, F., Ábrahám, P., Chen, L., et al. 2022, A&A, 663, A86 [NASA ADS] [CrossRef] [EDP Sciences] [Google Scholar]
- Melon Fuksman, D., Flock, M., Klahr, H., Mattia, G., & Muley, D. 2025, A&A, in press, https://doi.org/10.1051/0004-6361/202554994 [Google Scholar]
- Mendoza, V. E. E. 1968, ApJ, 151, 977 [Google Scholar]
- Molyarova, T., Akimkin, V., Semenov, D., et al. 2018, ApJ, 866, 46 [NASA ADS] [CrossRef] [Google Scholar]
- Nayakshin, S., & Elbakyan, V. 2024, MNRAS, 528, 2182 [Google Scholar]
- Pavlyuchenkov, Y. N. 2024, Astron. Rep., 68, 1045 [Google Scholar]
- Pavlyuchenkov, Y. N., & Akimkin, V. V. 2025, ArXiv e-prints [arXiv:2504.10220] [Google Scholar]
- Pavlyuchenkov, Y. N., Maksimova, L. A., & Akimkin, V. V. 2022, Astron. Rep., 66, 800 [Google Scholar]
- Pavlyuchenkov, Y. N., Akimkin, V. V., Topchieva, A. P., & Vorobyov, E. I. 2023, Astron. Rep., 67, 470 [Google Scholar]
- Pérez, S., Hales, A., Liu, H. B., et al. 2020, ApJ, 889, 59 [CrossRef] [Google Scholar]
- Pringle, J. E. 1981, ARA&A, 19, 137 [NASA ADS] [CrossRef] [Google Scholar]
- Rab, C., Elbakyan, V., Vorobyov, E., et al. 2017, A&A, 604, A15 [NASA ADS] [CrossRef] [EDP Sciences] [Google Scholar]
- Schneider, A. D., Dullemond, C. P., & Bitsch, B. 2018, A&A, 617, L7 [NASA ADS] [CrossRef] [EDP Sciences] [Google Scholar]
- Siwak, M., Winiarski, M., Ogłoza, W., et al. 2018, A&A, 618, A79 [NASA ADS] [CrossRef] [EDP Sciences] [Google Scholar]
- Steiner, D., Gehrig, L., Ratschiner, B., et al. 2021, A&A, 655, A110 [NASA ADS] [CrossRef] [EDP Sciences] [Google Scholar]
- Taquet, V., Wirström, E. S., & Charnley, S. B. 2016, ApJ, 821, 46 [Google Scholar]
- Visser, R., Bergin, E. A., & Jørgensen, J. K. 2015, A&A, 577, A102 [NASA ADS] [CrossRef] [EDP Sciences] [Google Scholar]
- Vorobyov, E. I., Elbakyan, V. G., Liu, H. B., & Takami, M. 2021, A&A, 647, A44 [EDP Sciences] [Google Scholar]
- Wachmann, A. 1954, Z. Astrophys., 35, 74 [NASA ADS] [Google Scholar]
- Wendeborn, J., Espaillat, C. C., Macías, E., et al. 2020, ApJ, 897, 54 [NASA ADS] [CrossRef] [Google Scholar]
- Wiebe, D. S., Molyarova, T. S., Akimkin, V. V., Vorobyov, E. I., & Semenov, D. A. 2019, MNRAS, 485, 1843 [Google Scholar]
- Wolf, S., & Voshchinnikov, N. V. 2004, Comput. Phys. Commun., 162, 113 [Google Scholar]
- Wolf, V., Stecklum, B., Caratti o Garatti, A., et al. 2024, A&A, 688, A8 [NASA ADS] [CrossRef] [EDP Sciences] [Google Scholar]
- Zhu, Z., Hartmann, L., Gammie, C., & McKinney, J. C. 2009, ApJ, 701, 620 [CrossRef] [Google Scholar]
- Zhu, Z., Jiang, Y.-F., & Stone, J. M. 2020, MNRAS, 495, 3494 [NASA ADS] [CrossRef] [Google Scholar]
- Zurlo, A., Weber, P., Pérez, S., et al. 2024, A&A, 686, A309 [NASA ADS] [CrossRef] [EDP Sciences] [Google Scholar]
- Zwicky, L., Molyarova, T., Akimkin, V., et al. 2024, MNRAS, 527, 7652 [Google Scholar]
Appendix A: Details of protoplanetary disk thermal model
To calculate the thermal evolution of a protoplanetary disk we adopt the FLDs method from Pavlyuchenkov et al. (2022). Here we summarize the model. The governing equations are
 (A.1)
(A.1)
 (A.2)
(A.2)
where ρ is the gas volume density, cV is its specific heat capacity [erg g−1 K−1], c is the speed of light, αP [cm−1] is the Planck-average opacity coefficient,  [erg cm−3 s−1] is the heating rate by central source radiation consisting of the stellar and accretion components, and
  [erg cm−3 s−1] is the heating rate due to internal disk dissipation, T is the temperature of the medium (equal for gas and dust), and E is the energy density of thermal radiation.
Equation (A.1) describes the change in the thermal energy of the medium due to the absorption and re-emission of thermal radiation (terms cαPE and cαPaT4, respectively), due to the absorption of direct central source radiation (S⋆), and due to internal accretion heating ( ). Equation (A.2) describes the change in the energy density of radiation due to the absorption and re-emission of thermal radiation, and due to the spatial diffusion of thermal radiation, represented by the operator
  ,
,
 (A.3)
(A.3)
where F is the flux of thermal radiation, αR is the Rosseland-average opacity coefficient, and λ is the flux limiter. The calculation of λ is performed according to the flux limited diffusion (FLD) theory (Levermore & Pomraning 1981).
The heating function due to central source radiation SUV is calculated as
 (A.4)
(A.4)
where FUV is the central source radiation flux integrated over frequency:
 (A.5)
(A.5)
The spectral flux  is calculated taking into account the true absorption of radiation from the star and active inner disk to the considered medium element along the radial direction. In this case the radial component of the flux is
 (A.6)
(A.6)
where Lν = Lν(t) is defined by Equation (2), and τν(R) is the optical depth at frequency ν along the line of sight from the star to the considered point. For simplicity, we neglect scattering for calculation of  . For the outburst models presented in this paper we assume the temporal behavior for the total luminosity
  , as shown in Fig. A.1.
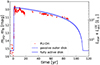 |
Fig. A.1. Central source luminosity profiles |

The system of equations (A.1)–(A.2) must be supplemented with boundary conditions. Thermal radiation from the inner boundary of the disk may partially escape via the polar regions. The amount of radiation returning to the disk from opposite walls depends on the height, position of the inner wall, and other disk parameters, and is difficult to predict in general. At the inner boundary of the spatial grid, we use the condition that the radiation flux is proportional to the product of energy density and the speed of light,
 (A.7)
(A.7)
where F is the radial component of the flux determined by Equation (A.3), and Ecmb is the energy density of the cosmic microwave background. The coefficient p is introduced phenomenologically and describes the fraction of freely escaping radiation. The value p = 1/2 corresponds to the case where radiation isotropically escapes the medium. The coefficient p = 1 (used in our modeling) corresponds to the limiting case where radiation freely escapes the medium perpendicular to the boundary.
The outer boundary conditions are set assuming free escape of the thermal radiation from the computational domain:
 (A.8)
(A.8)
The numerical method to solve Equations (A.1)–(A.2) is based on an implicit finite-difference scheme constructed in spherical coordinate system. The linearization of finite-difference equations allows to reduce the problem to a system of linear algebraic equations with a sparse matrix. To invert the matrix a modified Gauss method is adopted. More details on numerical method can be found in Pavlyuchenkov et al. (2022).
In our model, it is assumed that the only source of opacity is dust, and the temperatures of the gas and dust are equal. The ratio of dust density to gas density throughout the disk is assumed to be constant and equal to 0.01, i.e., the dust is considered uniformly mixed with the gas. The coefficients αP = ρκP and αR = ρκR appearing in the equations above, are determined via the Planck and Rosseland mean opacities, κP and κR [cm2 g (gas)−1]. The required Planck and Rosseland mean dust opacities are calculated using frequency-dependent absorption coefficients for a mixture of spherical silicate and carbonaceous dust particles (the mass fraction of carbonaceous dust particles is 0.2; the size distribution is n ∝ a−3.5 with minimal and maximal radii of the dust particles being 0.005 and 1 μm, respectively). The frequency-dependent absorption coefficients themselves are calculated using the Mie theory (Wolf & Voshchinnikov 2004). The mean and frequency-dependent opacities for the considered dust grain ensemble are shown in Fig. 1 of Pavlyuchenkov (2024). We take 5/3 for the value of the gas heat capacity ratio, which represents molecular hydrogen at low temperatures and 3:1 ortho-para ratio (≲150 K) as well as helium. The assumed mean molecular weight is 2.3.
Owing to the consideration of UV/optical heating via the SUV term, the FLDs method implemented in HURAKAN provides accurate calculation of dust temperature in the upper disk layers that are optically thin for thermal radiation. The use of Planck and Rosseland opacities speeds up the calculation of the time-dependent radiation transfer and allows for its use in hydrodynamical simulations. However, the spectrally averaged opacities and the diffusion nature of the FLD approach lead to a loss of accuracy of temperature calculation in anisotropic setups like protoplanetary disks. In Fig. A.2 we show the radial profiles of disk temperatures calculated with HURAKAN and RADMC-3D at pre-outburst stage for Model P. As HURAKAN radiation transfer module is time-dependent, we assume a long time-step of 104 yr, which is larger than thermal timescales, to match the stationary approach of RADMC-3D. While the temperature profiles in the disk upper layers (the polar angle θ = 45°) calculated with the two codes almost ideally correspond to each other, the FLD temperatures are notably higher in the midplane. The difference is caused by both the spectral averaging of opacities and anisotropic disk conditions (Dullemond et al. 2002; Pavlyuchenkov & Akimkin 2025; Melon Fuksman et al. 2025). More details on the numerical tests and benchmarking between HURAKAN and RADMC-3D codes in stationary approximation are presented in Pavlyuchenkov (2024) and Pavlyuchenkov & Akimkin (2025).
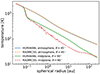 |
Fig. A.2. Comparison between temperatures calculated using HURAKAN (FLDs) and RADMC-3D (Monte Carlo) in the disk atmosphere (polar angle θ = 45°) and midplane (θ = 90°) for stationary pre-outburst stage. |
Appendix B: Calculating the heating in fully active disk model
We assume that luminosity during the accretion event is provided mostly by the release rate of gravitational energy Lgrav = GM⋆Ṁ/R⋆, so the accretion rate Ṁ onto the star is:
 (B.1)
(B.1)
where M⋆ and R⋆ are the stellar mass and radius. For the fully active disk model we assume that the accretion rate is constant over the disk, equals to that onto the star and results in a time-independent gas surface density (contrary to the passive outer disk model where the accretion energy is assumed to be released in a compact inner region providing only UV/optical heating to the outer passive disk).
We assume that the heating rate of the disk beyond some radius RA is equal to the release rate of gravitational energy,
 (B.2)
(B.2)
where the coefficient (1/2) accounts for the fact that half of the gravitational energy is converted into Keplerian motion of the gas.
In our approach, the disk is split into two parts at some radius RA. The inner part of the active disk, R < RA, is so hot that its UV/optical radiation is treated as the contribution to the central luminosity source. In the outer part of active disk R > RA the accretion heating contributes mostly to the thermal radiation and has the energy release rate of  . The sum of the energy release rates in two parts of active disk provides the gravitational energy release rate
  . The accretion contribution to central source luminosity can be rewritten as
 (B.3)
(B.3)
The heating function  per unit disk area which is consistent with Equation (B.2), i.e.,
  , has the form
 (B.4)
(B.4)
The heating rate per unit volume due to internal accretion heating is finally calculated as
 (B.5)
(B.5)
where Σg is the surface density of the disk.
In our prescription of active disk model we do not use the standard formalism of the viscous disks, which was initially developed for black holes. In the stationary case, the heating rate due to viscous dissipation is usually written as (Pringle 1981)
![Mathematical equation: $$ \begin{aligned} \Gamma _{\rm vis} = \dfrac{3}{4\pi }\dfrac{GM_{\star }\dot{M}}{R^3} \left[1-\left(\dfrac{R_\star }{R}\right)^{1/2}\right], \end{aligned} $$](/articles/aa/full_html/2025/08/aa54962-25/aa54962-25-eq35.gif) (B.6)
(B.6)
which vanished in the stellar vicinity. This rate is coupled with the equation for the stationary surface density distribution,
![Mathematical equation: $$ \begin{aligned} \nu \Sigma _{\rm g} = \dfrac{\dot{M}}{3\pi } \left[1-\left(\dfrac{R_\star }{R}\right)^{1/2}\right], \end{aligned} $$](/articles/aa/full_html/2025/08/aa54962-25/aa54962-25-eq36.gif) (B.7)
(B.7)
where ν is the kinematic viscosity. Combining Equations B.6 and B.7 provides the classical heating rate Γvis = (9/4)νΣgΩK2 (Pringle 1981).
The problem of using Equations (B.6) – (B.7) is that they are derived assuming a zero-torque boundary condition, which can be less appropriate for protoplanetary disks than for black holes. In particular, Equation (B.7) forces the surface density to vanish at the stellar boundary R⋆ resulting in an infinite radial velocity at this location to keep the fixed value of Ṁ. The outcome of the zero-torque boundary is also that viscous heating rate (B.6) is zero at R⋆ but is three times higher than the rate of gravitational energy release (B.4) at R ≫ R⋆. Given these circumstances, we prefer to use Equation (B.4) to satisfy local energy conservation relations but neglecting possible nonlocal effects of turbulent viscosity.
Appendix C: Characteristic timescales for disk midplane radiative heating and cooling
The energy balance equation can be written per unit surface as
 (C.1)
(C.1)
where u [erg g−1] is the specific internal energy of the gas, related to the specific heat capacity cV as u = cVT for temperature independent cV, Γ and Λ are the heating and cooling functions, respectively. According to Pavlyuchenkov et al. (2023), they can be approximated as
 (C.2)
(C.2)
where T is the midplane temperature, τP and τR are the Planck and Rosseland optical depths to the disk midplane equal to (1/2)κPΣg and (1/2)κRΣg, respectively, μ0 is the cosine of the angle between the direction to the star and the normal to the disk surface (taken as 0.05), and F0 is the stellar radiative flux incident on the disk surface at a given radius.
To estimate the characteristic heating timescale theat of the disk midplane, let us consider a sharp increase in disk heating, i.e., Λ ≪ Γ. By substituting Equations (C.2) into (C.1) and solving for time (for estimates, we use  and ΔT ∼ T), we derive the disk heating time theat as a function of the radial position in the disk,
 (C.3)
(C.3)
where T0 is the midplane temperature of the disk at the time just before the outburst.
Similarly, in the case of a sharp decline of disk heating (Λ ≫ Γ), the disk cooling timescale tcool is derived as
 (C.4)
(C.4)
where Tmax is the maximum midplane temperature attained during the outburst, for which we take the moment of t = 2 yr.
The resulting characteristic timescales for Model P as a function of disk radial position are shown in Fig. C.1, the radial profiles of the gas surface density Σg/2 to the disk midplane and the corresponding Planck optical depth τP are also plotted. These analytical estimates are consistent with the full simulations shown in Fig. 1.
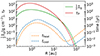 |
Fig. C.1. Characteristic timescales for the disk midplane heating (at t = 0) and cooling (at t = 2 yr) for Model P shown with the dashed lines. The gas surface density and the Planck optical depth to the disk midplane are shown with the solid lines. |
All Figures
|
Fig. 1. Evolution of the disk thermal structure during the outburst for the passive outer disk model (Model P; upper set of panels) and the fully active disk model (Model A; lower set of panels). Each panel set shows a selection of time moments; the total outburst energetics are shown in the legend of each panel. The lower right panel in each set presents the midplane temperature radial profile for the same time moments. The chosen coordinates for the heatmaps lg(R/au)sinθ − lg(R/au)cosθ allow us to highlight the inner and midplane regions and are convenient for representing data obtained on the polar (R, θ) grid. |
| In the text | |
|
Fig. 2. Left panel: Spectral energy distributions for different stages of the outburst. The profiles for Model P and Model A are shown with dashed and solid lines, respectively. Right panel: Evolution of the corresponding radiation fluxes for several wavelengths. The reference ratio |
| In the text | |
|
Fig. A.1. Central source luminosity profiles |
| In the text | |
|
Fig. A.2. Comparison between temperatures calculated using HURAKAN (FLDs) and RADMC-3D (Monte Carlo) in the disk atmosphere (polar angle θ = 45°) and midplane (θ = 90°) for stationary pre-outburst stage. |
| In the text | |
|
Fig. C.1. Characteristic timescales for the disk midplane heating (at t = 0) and cooling (at t = 2 yr) for Model P shown with the dashed lines. The gas surface density and the Planck optical depth to the disk midplane are shown with the solid lines. |
| In the text | |
Current usage metrics show cumulative count of Article Views (full-text article views including HTML views, PDF and ePub downloads, according to the available data) and Abstracts Views on Vision4Press platform.
Data correspond to usage on the plateform after 2015. The current usage metrics is available 48-96 hours after online publication and is updated daily on week days.
Initial download of the metrics may take a while.