Fig. 1.
Download original image
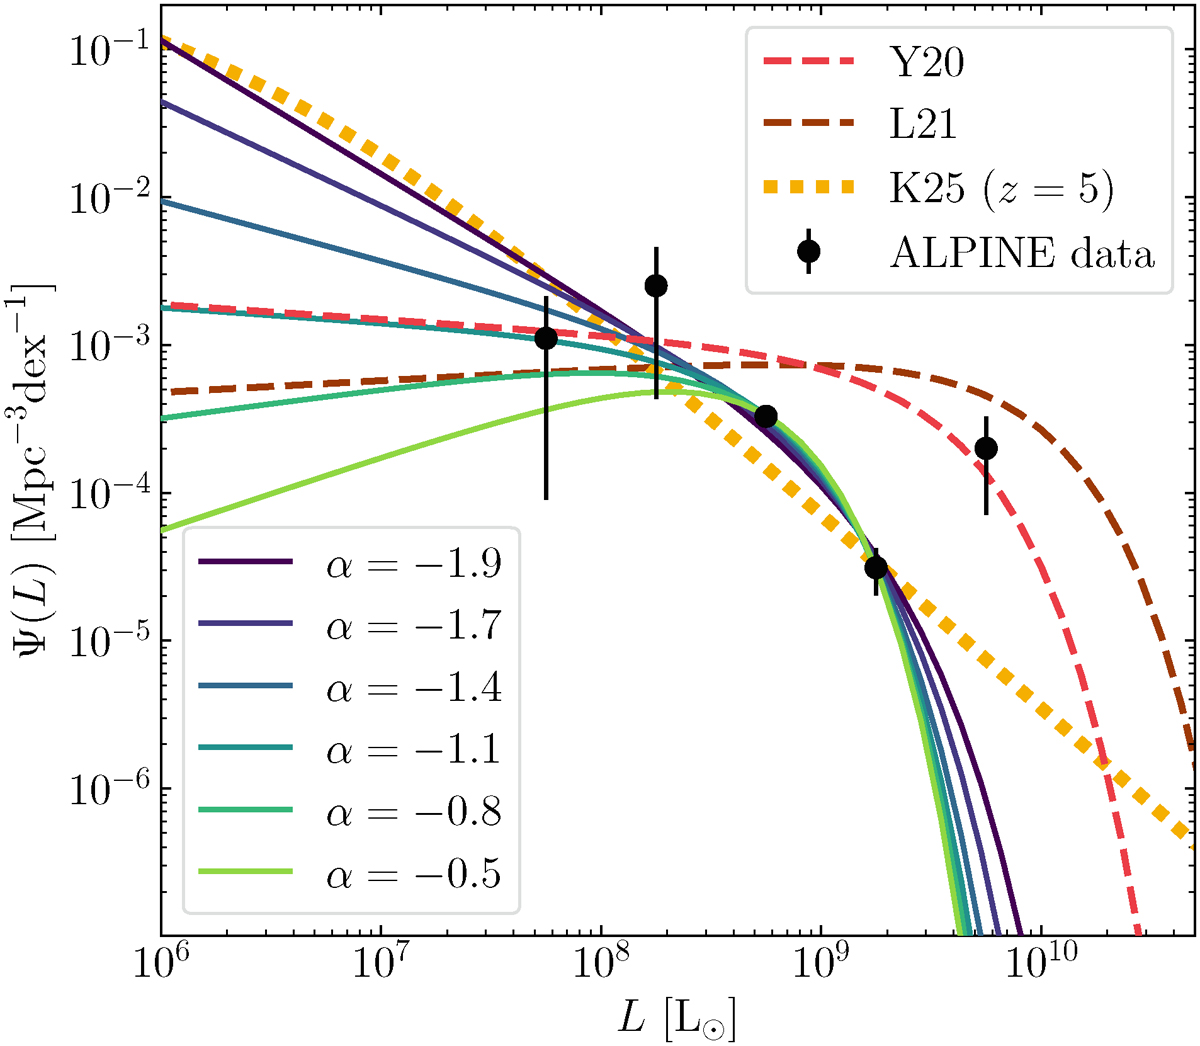
[C II] LF estimated from the targeted ALPINE detections by Yan et al. (2020, Y20) (black data points and error bars). We show the average between the estimates at redshift z ∼ 4.5 and 5.5. Our Schechter fits to the data are superposed with different fixed values of the faint-end slope α (purple, blue, and green lines). The dashed red line shows the LF fit obtained by Y20 combining multiple datasets at different wavelengths. The fit by Loiacono et al. (2021, L21) to the serendipitous (and clustered) ALPINE detections is shown with a dashed brown line. For comparison, the LF from the MARIGOLD numerical simulations by Khatri et al. (2025, K25) at z = 5 is represented by a dotted gold line.
Current usage metrics show cumulative count of Article Views (full-text article views including HTML views, PDF and ePub downloads, according to the available data) and Abstracts Views on Vision4Press platform.
Data correspond to usage on the plateform after 2015. The current usage metrics is available 48-96 hours after online publication and is updated daily on week days.
Initial download of the metrics may take a while.