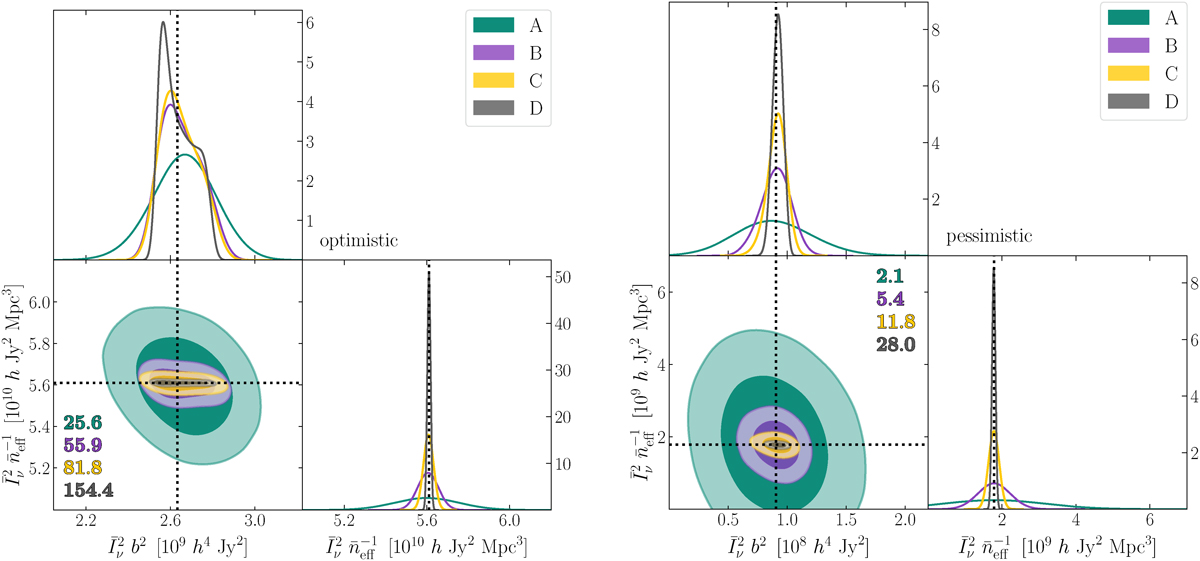
Fig. 11.
Download original image
Marginalised posterior distributions of the parameters ![]() and
and ![]() for the different surveys listed in Table 4. The left and right panels refer to the optimistic and pessimistic cases, respectively. Shown are the 68% and 95% credible regions (shaded) and the underlying true values (dotted). Also indicated is the figure of merit defined in Eq. (42).
for the different surveys listed in Table 4. The left and right panels refer to the optimistic and pessimistic cases, respectively. Shown are the 68% and 95% credible regions (shaded) and the underlying true values (dotted). Also indicated is the figure of merit defined in Eq. (42).
Current usage metrics show cumulative count of Article Views (full-text article views including HTML views, PDF and ePub downloads, according to the available data) and Abstracts Views on Vision4Press platform.
Data correspond to usage on the plateform after 2015. The current usage metrics is available 48-96 hours after online publication and is updated daily on week days.
Initial download of the metrics may take a while.