Fig. 17.
Download original image
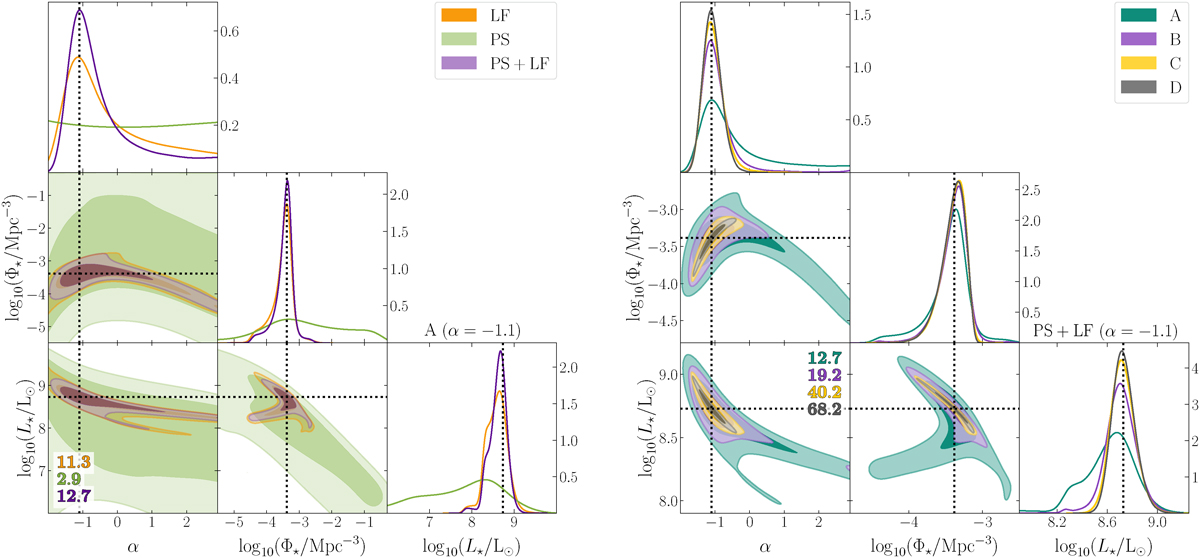
Left: Marginalised posterior distributions of the LF parameters obtained by fitting the LIM PS (green), the number counts of the targeted ALPINE survey (orange), and the combination of the two datasets (violet). The shaded areas indicate the 68% and 95% credible regions. Right: As in the left panel, but for the fit of the combined datasets and for different LIM surveys.
Current usage metrics show cumulative count of Article Views (full-text article views including HTML views, PDF and ePub downloads, according to the available data) and Abstracts Views on Vision4Press platform.
Data correspond to usage on the plateform after 2015. The current usage metrics is available 48-96 hours after online publication and is updated daily on week days.
Initial download of the metrics may take a while.