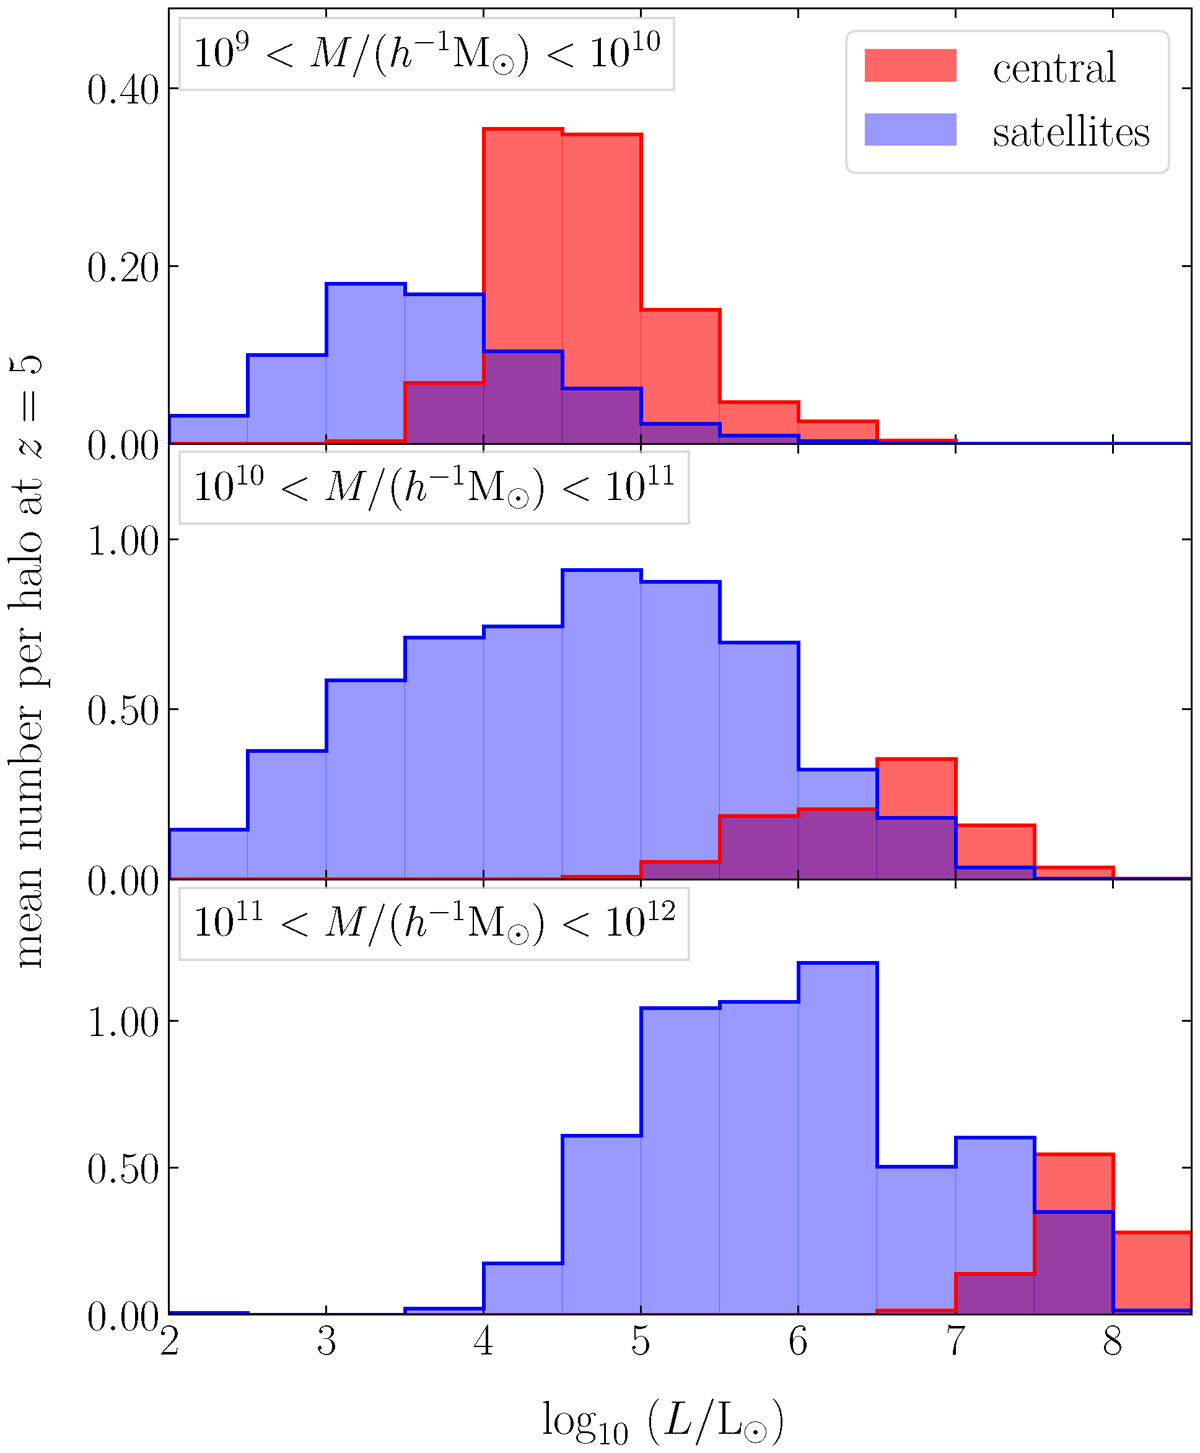
Fig. 3.
Download original image
CLF extracted from the MARIGOLD simulations at z = 5 in three halo mass bins. The contributions from central and satellite [C II] emitters are indicated in different colours. The scale of the y-axis changes in the different panels. Quantitative information about the CLF is provided in Table 2. The top two panels refer to the high-resolution simulation, and the bottom panel is obtained from the low-resolution simulation, which contains more massive haloes.
Current usage metrics show cumulative count of Article Views (full-text article views including HTML views, PDF and ePub downloads, according to the available data) and Abstracts Views on Vision4Press platform.
Data correspond to usage on the plateform after 2015. The current usage metrics is available 48-96 hours after online publication and is updated daily on week days.
Initial download of the metrics may take a while.