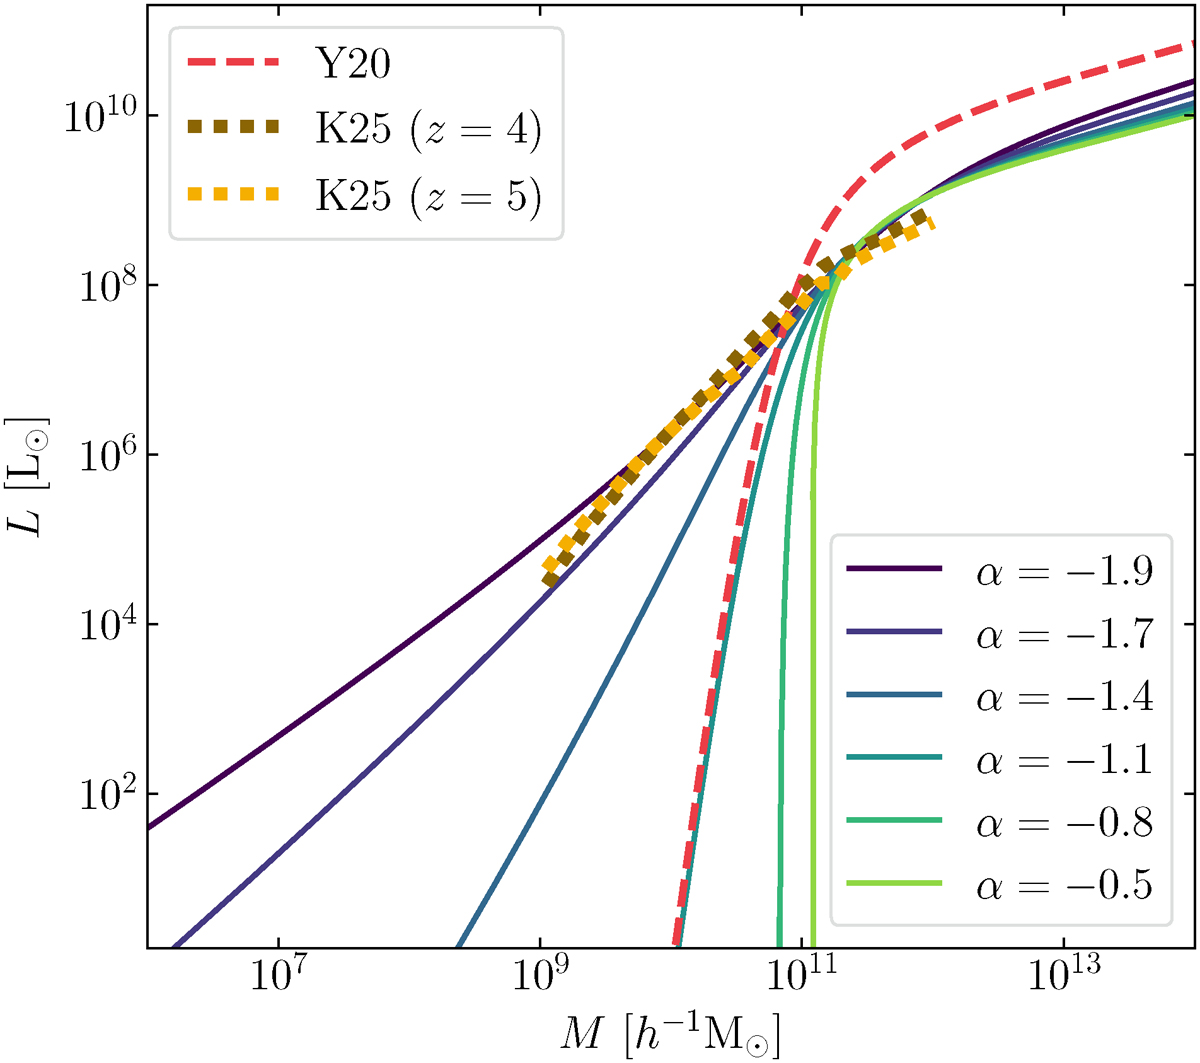
Fig. 4.
Download original image
[C II] luminosity as a function of halo mass obtained via abundance matching. The colours for the solid-line fits to the ALPINE data at z ≃ 5 are the same as in Fig. 1. The dashed red line refers to the LF fit obtained by Y20. The dotted gold and dark gold lines show the actual η1 function (i.e. the mean total luminosity per halo) extracted by K25 at z = 5 and z = 4, respectively.
Current usage metrics show cumulative count of Article Views (full-text article views including HTML views, PDF and ePub downloads, according to the available data) and Abstracts Views on Vision4Press platform.
Data correspond to usage on the plateform after 2015. The current usage metrics is available 48-96 hours after online publication and is updated daily on week days.
Initial download of the metrics may take a while.