Fig. 7.
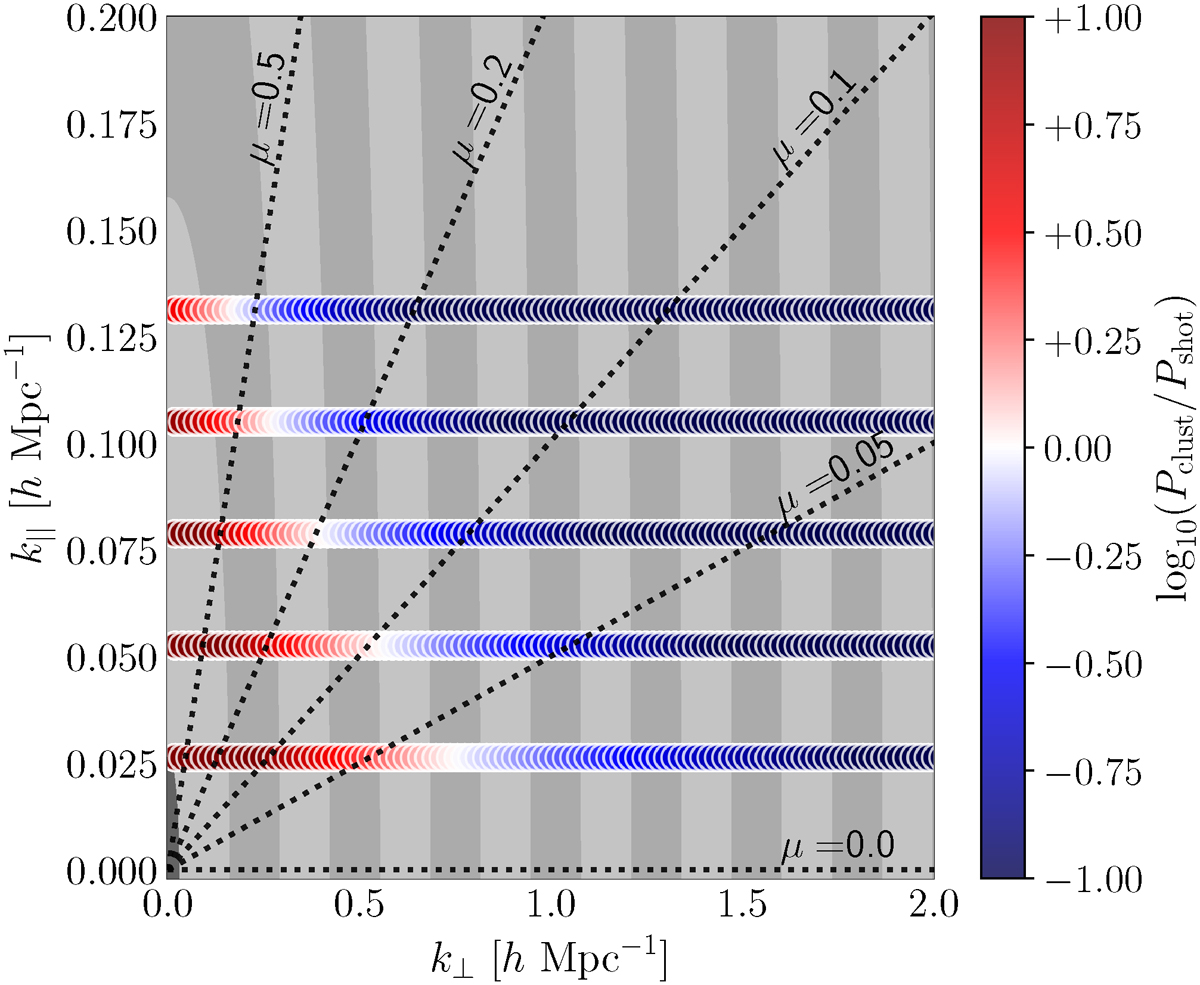
Download original image
Location in the (k⊥, k∥) plane of the Fourier modes that are available in a 16 sq. deg. survey conducted with EoR-Spec (R = 100) at z ≃ 3.6 and with η⊥ = η∥ = 1 (partially overlapping circles). The colour indicates the ratio of the corresponding clustering and shot-noise contributions to the PS (for our pessimistic LF with α = −1.1). The light and dark grey bands highlight the bins adopted in our analysis (Δk = 5 kf∥ ≃ 0.13 h Mpc−1). These are annuli but appear as vertical bands due to the strong asymmetry in the scales along the axes. The dotted lines denote fixed values of μ = k∥/k.
Current usage metrics show cumulative count of Article Views (full-text article views including HTML views, PDF and ePub downloads, according to the available data) and Abstracts Views on Vision4Press platform.
Data correspond to usage on the plateform after 2015. The current usage metrics is available 48-96 hours after online publication and is updated daily on week days.
Initial download of the metrics may take a while.