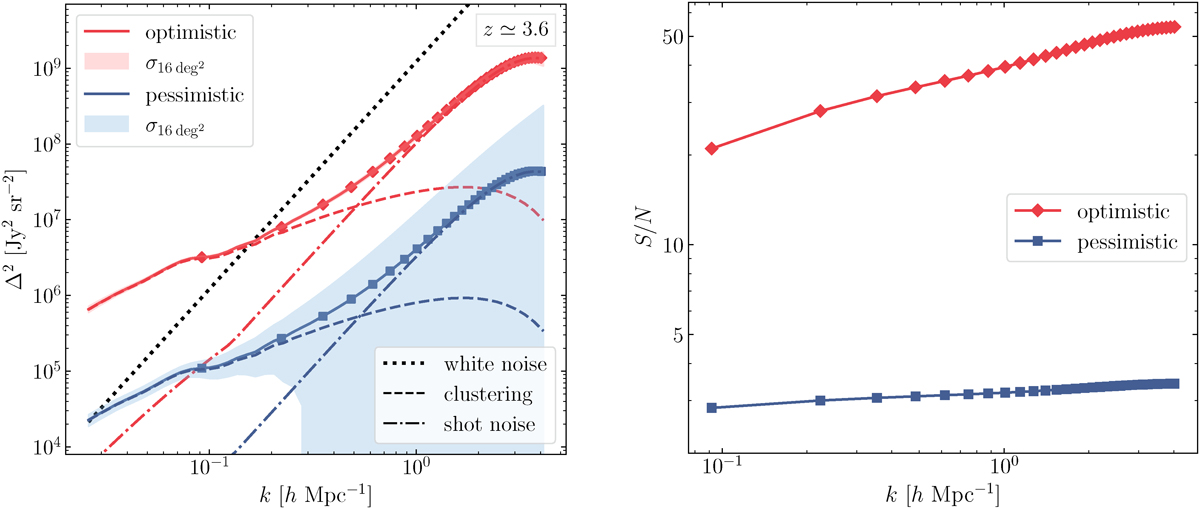
Fig. 8.
Download original image
Left: Function Δ2(k, z ≃ 3.6) for our optimistic and pessimistic cases (solid lines) and its statistical uncertainty (shaded regions) estimated for a 16 sq. deg. survey with R = 100. The dotted line shows the white-noise spectrum for EoR-Spec, and the dashed and dot-dashed lines refer to the clustering and shot-noise components, respectively. Right: Cumulative S/N for the spectra shown in the left panel. In both panels, the markers indicate the centre of our k-bins.
Current usage metrics show cumulative count of Article Views (full-text article views including HTML views, PDF and ePub downloads, according to the available data) and Abstracts Views on Vision4Press platform.
Data correspond to usage on the plateform after 2015. The current usage metrics is available 48-96 hours after online publication and is updated daily on week days.
Initial download of the metrics may take a while.