Fig. 9.
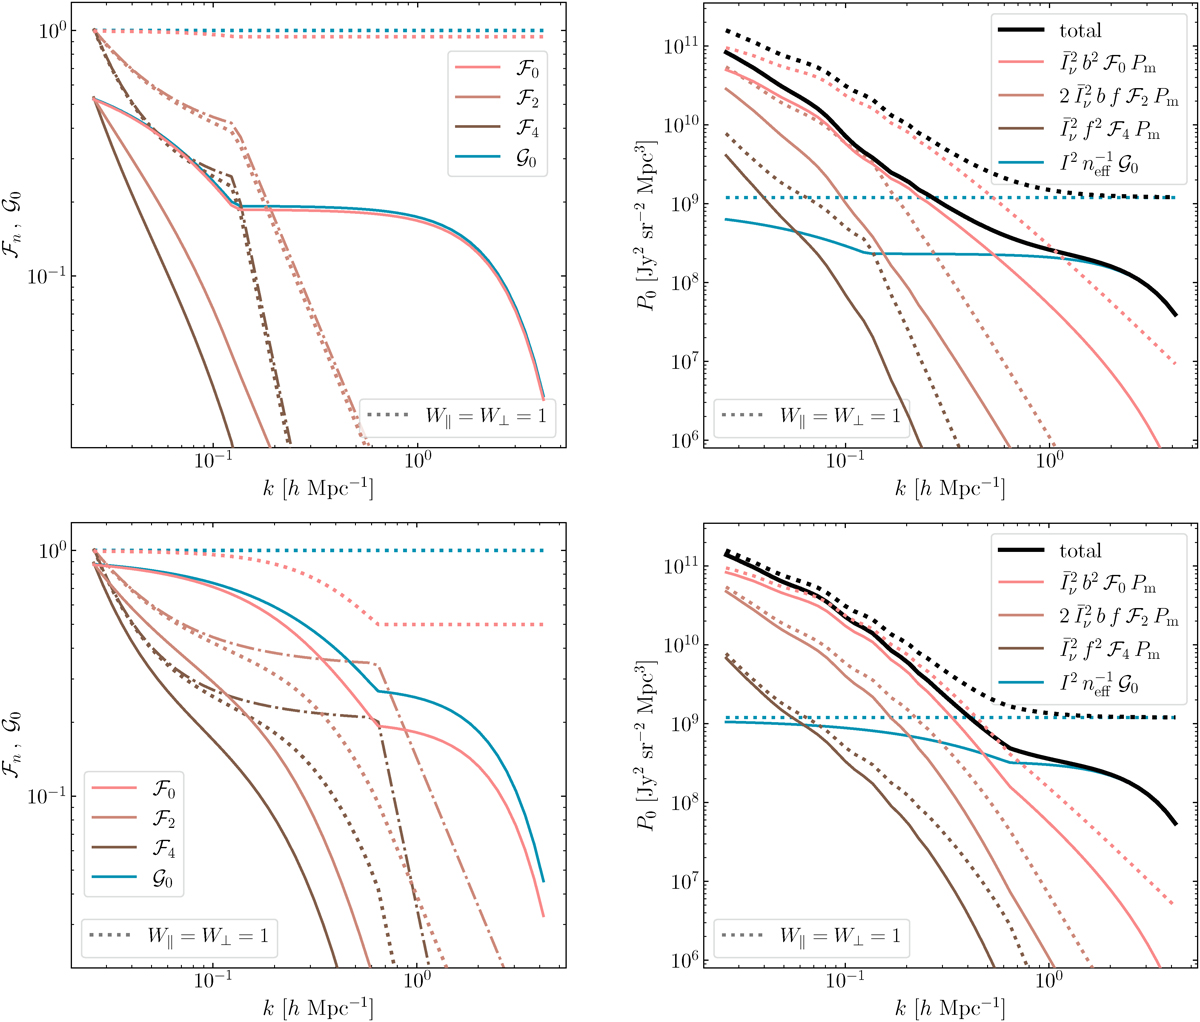
Download original image
Left: Functions ℱ0, ℱ2, ℱ4, and 𝒢0 defined in Eqs. (37) and (38) for our observational setup, assuming σ = 3 h−1 Mpc and a spectral resolving power of R = 100 (top panel) or R = 500 (bottom panel). The dash-dotted lines represent the analytic approximations given in Eqs. (39) and (40), with colours matching those used for ℱ2 and ℱ4, respectively. Right: Individual components of the LIM power spectrum entering Eq. (36) for our pessimistic luminosity function with α = −1.1 (similar results are found for other LF assumptions).
Current usage metrics show cumulative count of Article Views (full-text article views including HTML views, PDF and ePub downloads, according to the available data) and Abstracts Views on Vision4Press platform.
Data correspond to usage on the plateform after 2015. The current usage metrics is available 48-96 hours after online publication and is updated daily on week days.
Initial download of the metrics may take a while.