Fig. 11.
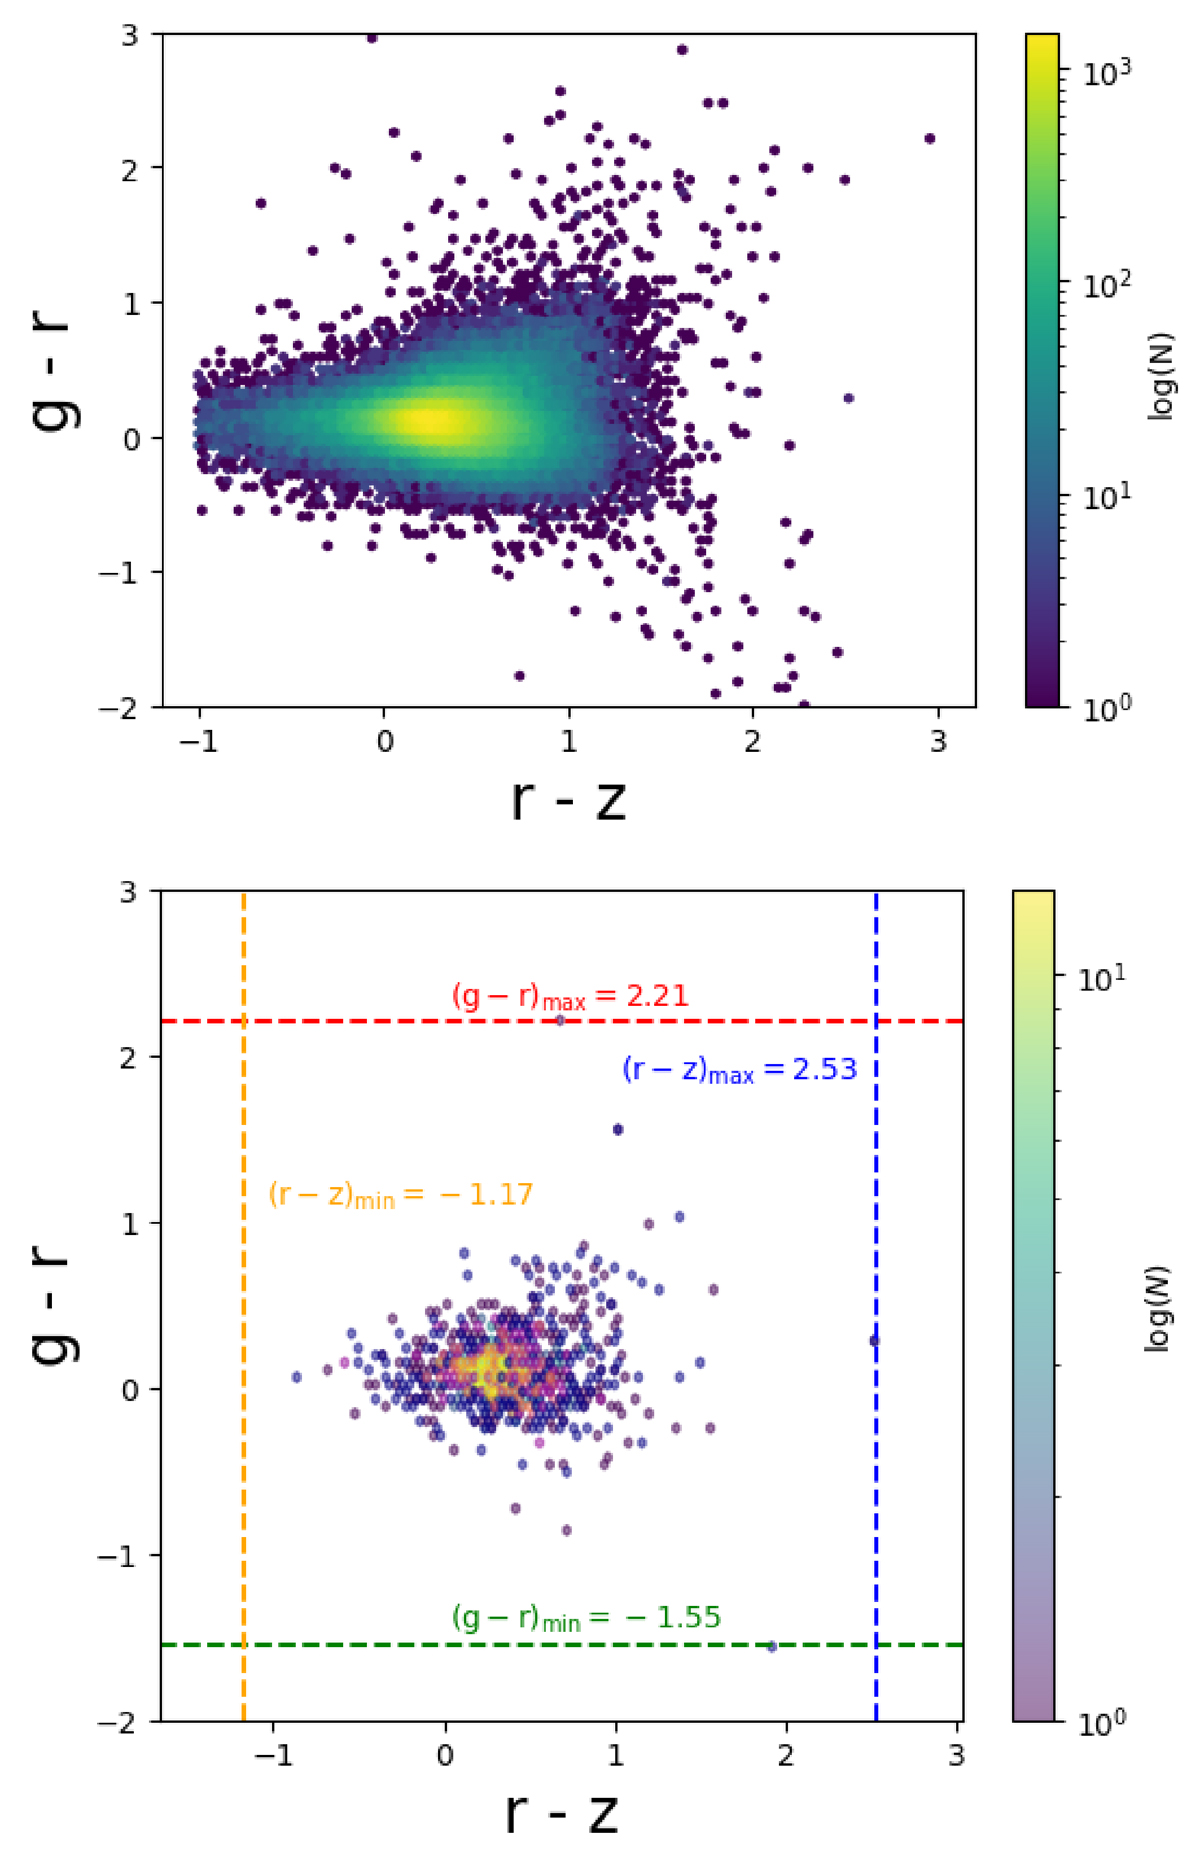
Download original image
Top panel: Color-color map for the entire subsample of quasars. Bottom panel: Color-color map for the detected quasar pairs. Here, log(N) represents the logarithm of the number of quasar pairs within each region of the color-color map. Note that in some cases, the maximum or minimum values may lie outside the displayed data range.
Current usage metrics show cumulative count of Article Views (full-text article views including HTML views, PDF and ePub downloads, according to the available data) and Abstracts Views on Vision4Press platform.
Data correspond to usage on the plateform after 2015. The current usage metrics is available 48-96 hours after online publication and is updated daily on week days.
Initial download of the metrics may take a while.