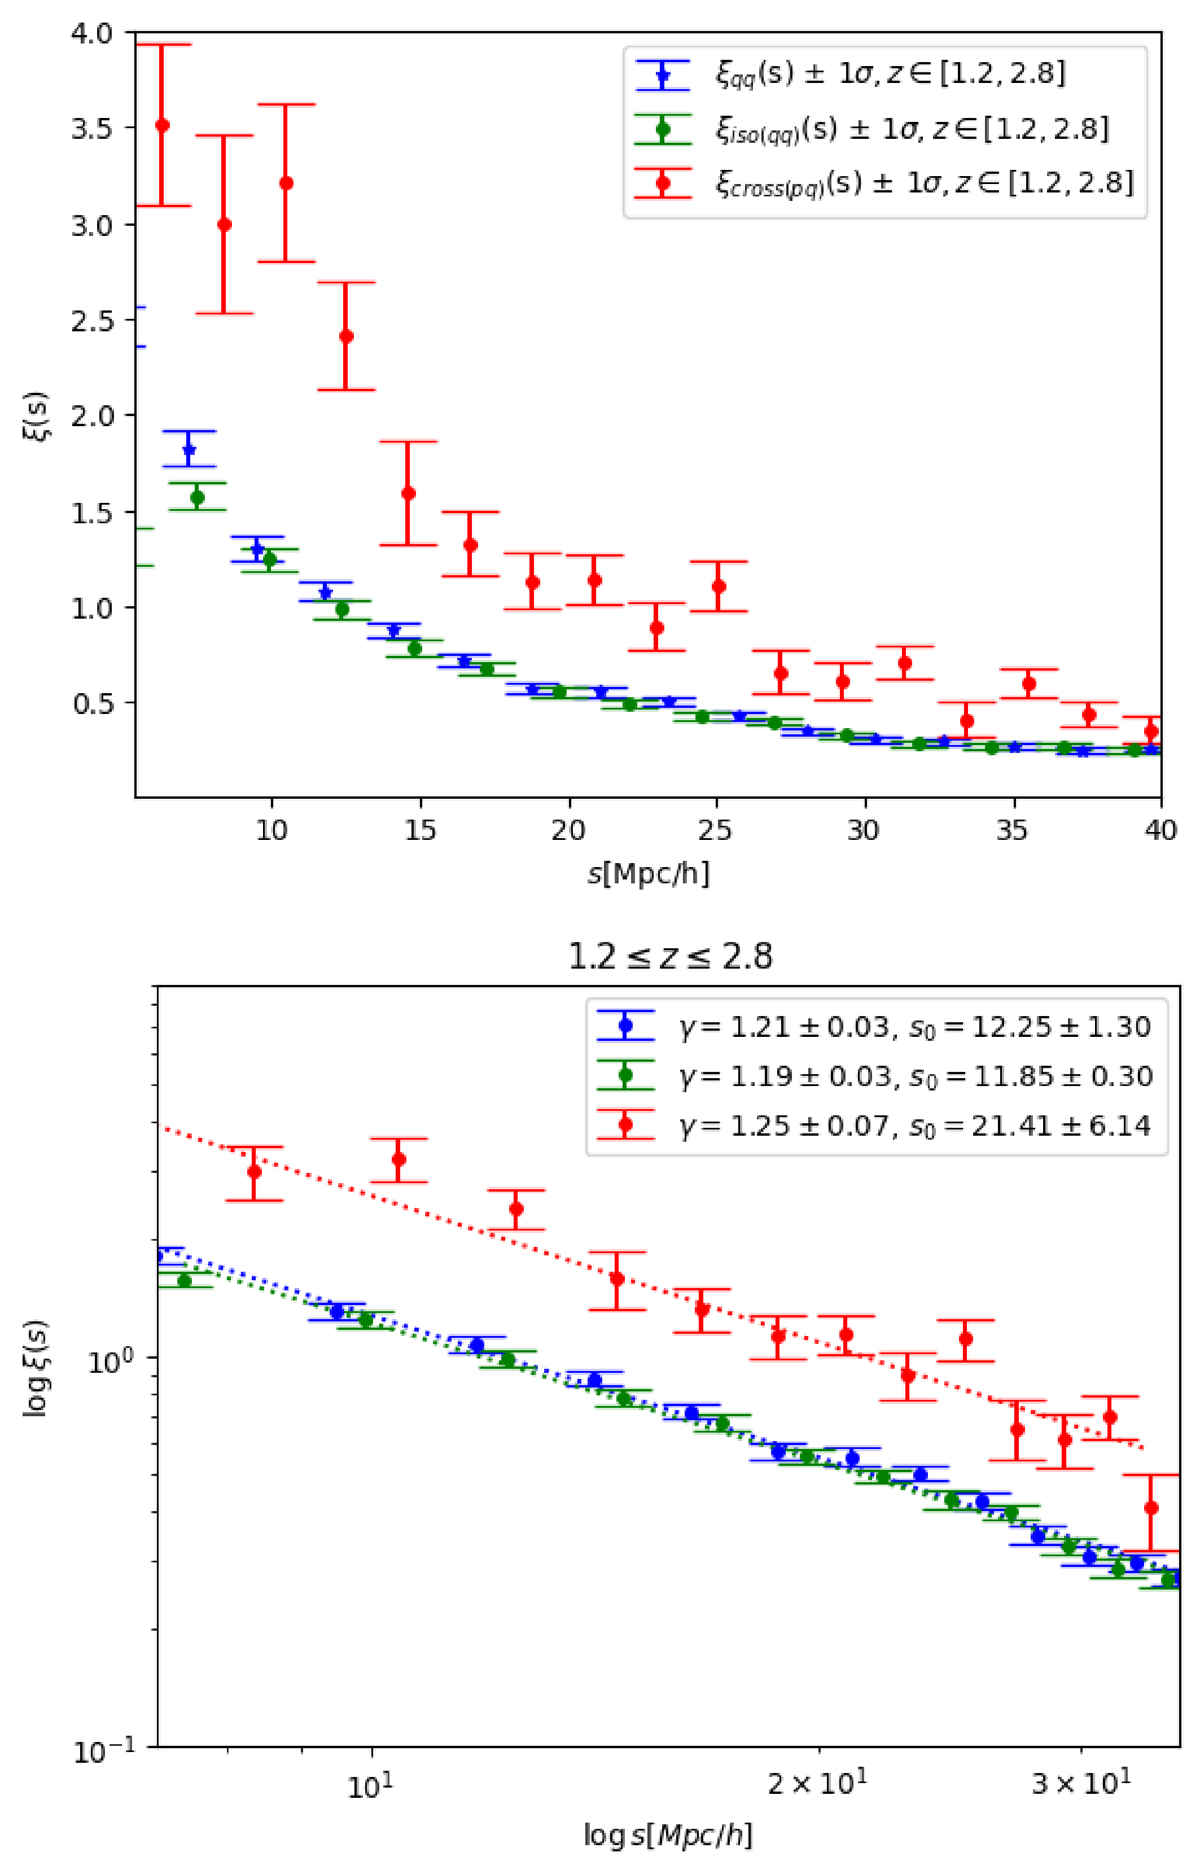
Fig. 13.
Download original image
Top panel: Comparison of the two-point cross-correlation function, derived using the LS estimator between quasar pairs and individual quasars within the 1.2 ≤ z ≤ 2.8 redshift window. The cross-correlation is shown alongside autocorrelation for the full sample in that interval and for isolated quasars. Bottom panel: Linear regressions for the three cases are depicted on a logarithmic scale to visualize their slopes. The estimates of (γ, s0) remain consistent across all three cases.
Current usage metrics show cumulative count of Article Views (full-text article views including HTML views, PDF and ePub downloads, according to the available data) and Abstracts Views on Vision4Press platform.
Data correspond to usage on the plateform after 2015. The current usage metrics is available 48-96 hours after online publication and is updated daily on week days.
Initial download of the metrics may take a while.