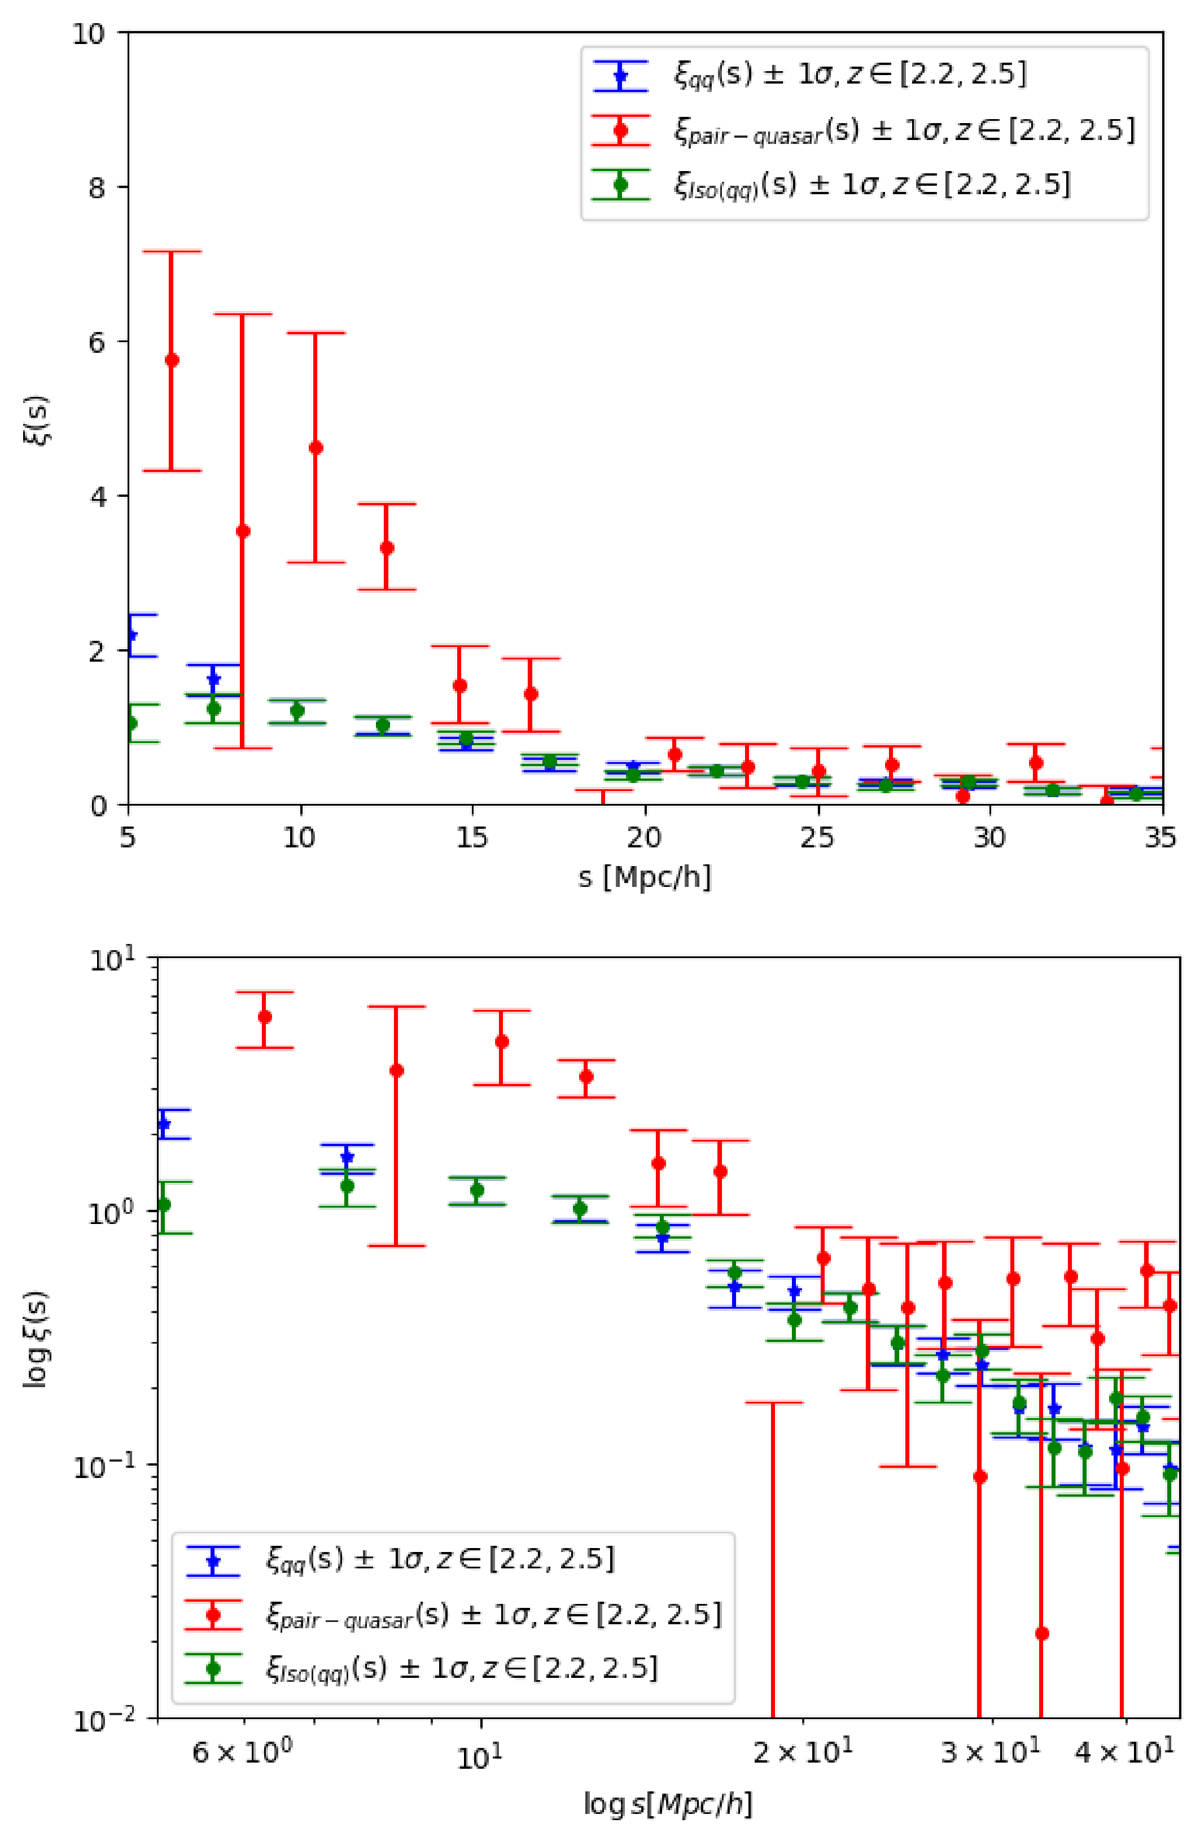
Fig. 15.
Download original image
Top panel: Two-point correlation function derived using the LS estimator for the cross-correlation between quasar pairs and individual quasars within the redshift interval 2.2 ≤ z ≤ 2.5. The 2PCF for the entire subsample is included, computed using the resampling bootstrap method, as well as the 2PCF for isolated quasars not belonging to any pair. Bottom panel: The same 2PCFs are presented on a logarithmic scale.
Current usage metrics show cumulative count of Article Views (full-text article views including HTML views, PDF and ePub downloads, according to the available data) and Abstracts Views on Vision4Press platform.
Data correspond to usage on the plateform after 2015. The current usage metrics is available 48-96 hours after online publication and is updated daily on week days.
Initial download of the metrics may take a while.