Fig. 16.
Download original image
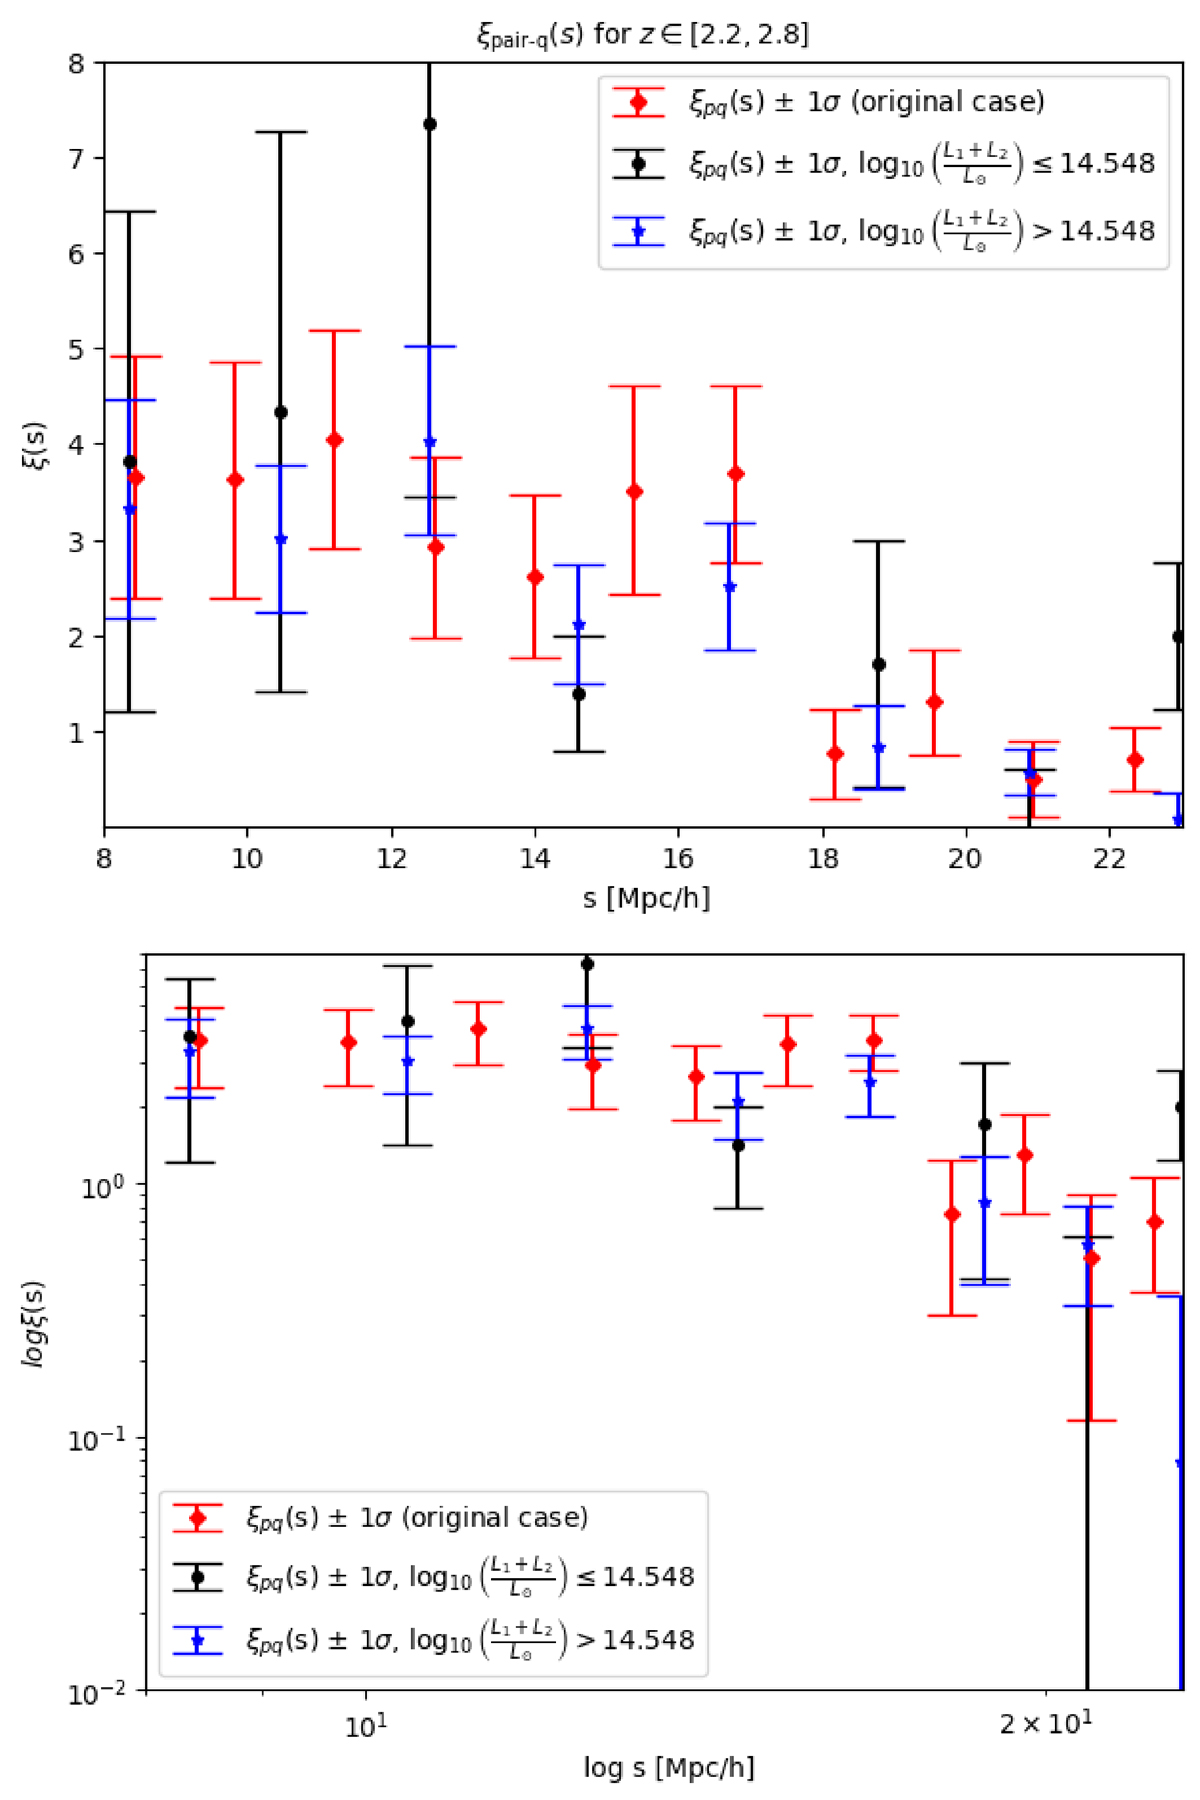
Top panel: Comparison of two-point cross-correlation functions obtained using the LS estimator between quasar pairs and individual quasars in the 2.2 ≤ z ≤ 2.8 redshift window, shown with different partition criteria. Bottom panel: The same two-point cross-correlation functions are displayed on logarithmic scales to visualize their slopes.
Current usage metrics show cumulative count of Article Views (full-text article views including HTML views, PDF and ePub downloads, according to the available data) and Abstracts Views on Vision4Press platform.
Data correspond to usage on the plateform after 2015. The current usage metrics is available 48-96 hours after online publication and is updated daily on week days.
Initial download of the metrics may take a while.