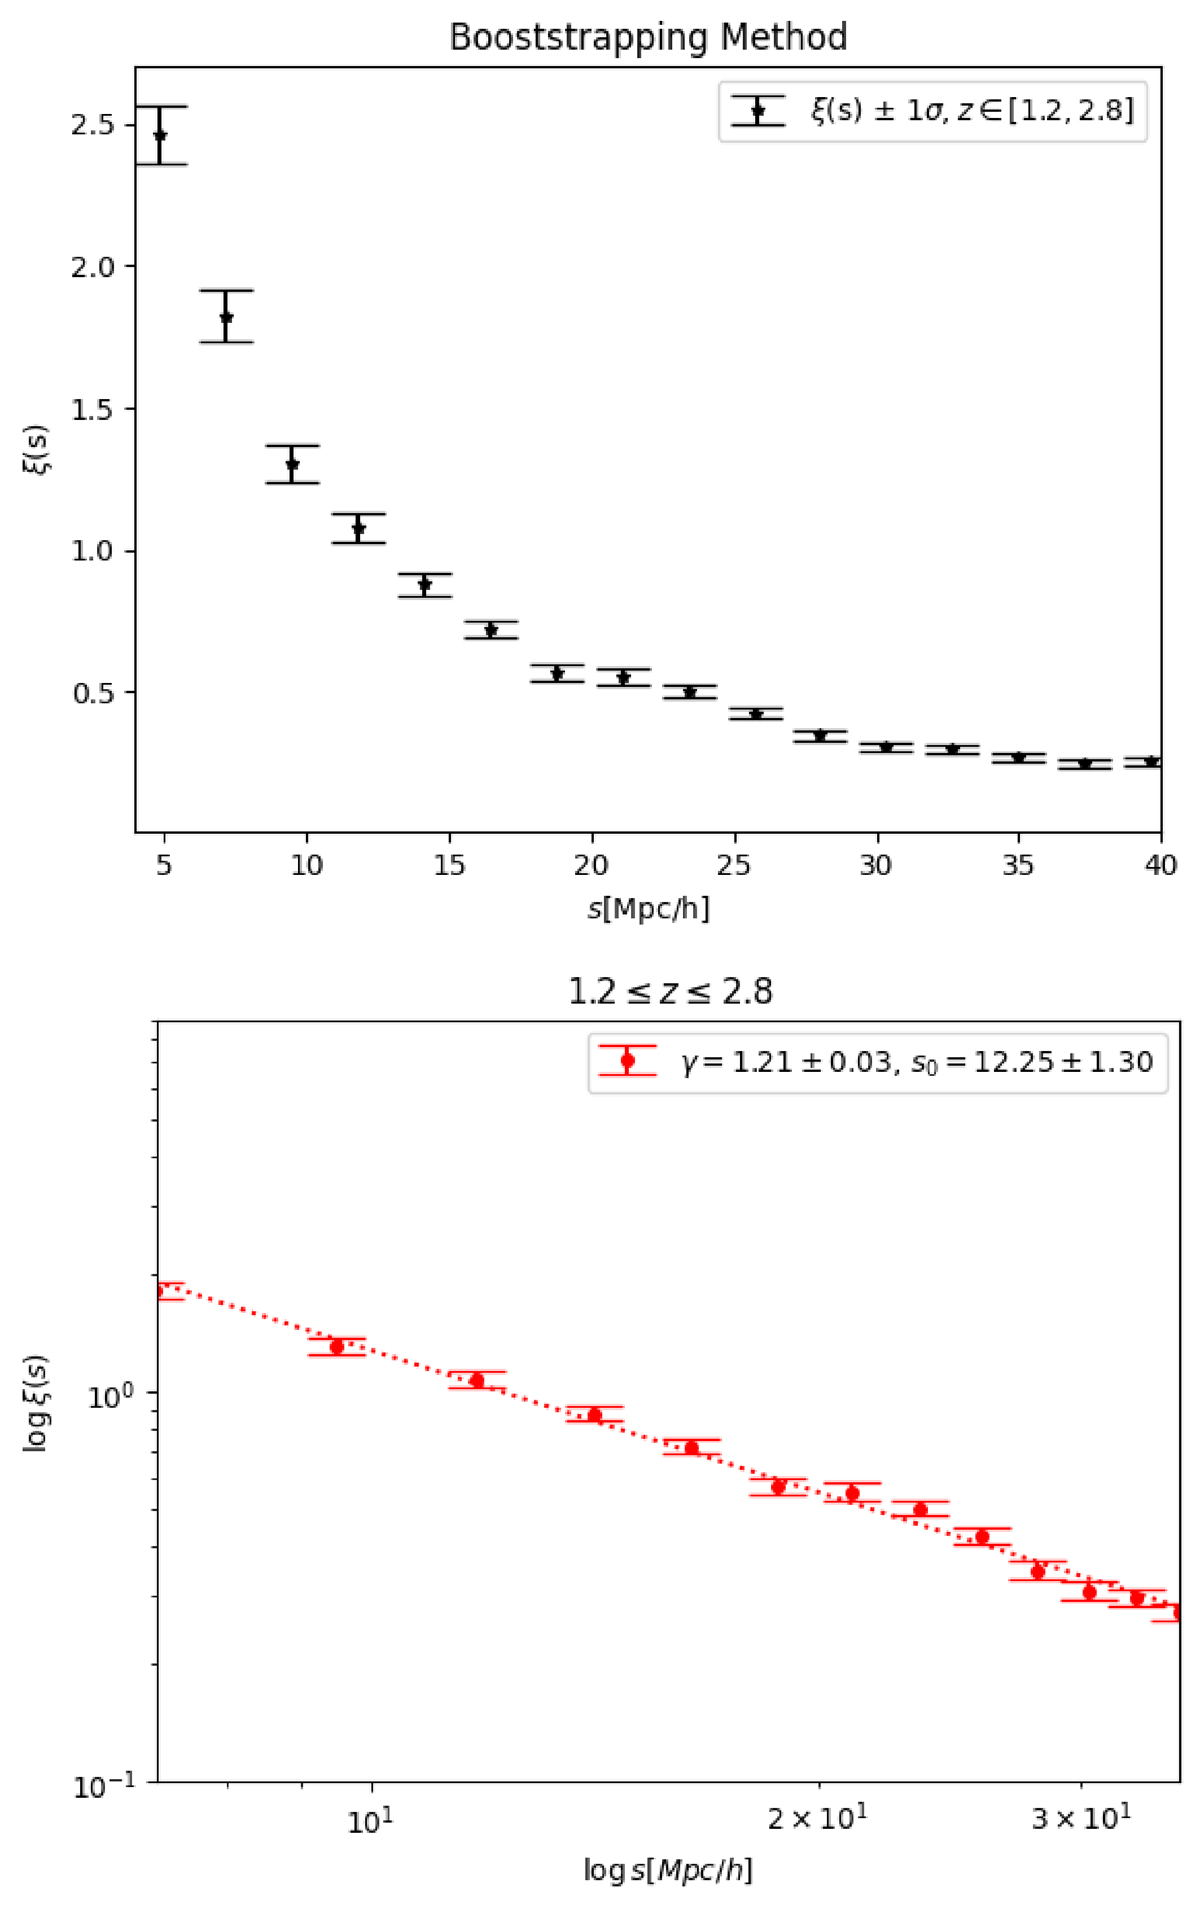
Fig. 4.
Download original image
Top panel: Two-point correlation function obtained using the LS estimator for the total sample, z ∈ [1.2, 2.8]. Red point represents the correlation function with its error bars. Bottom panel: The dashed red curve indicates the best linear fit in logarithm scale. In the linear regime, the correlation function can be parametrized as ξ(s) = (s/s0)−γ with γ = 1.21 ± 0.03 and s0 = 12.25 ± 1.30.
Current usage metrics show cumulative count of Article Views (full-text article views including HTML views, PDF and ePub downloads, according to the available data) and Abstracts Views on Vision4Press platform.
Data correspond to usage on the plateform after 2015. The current usage metrics is available 48-96 hours after online publication and is updated daily on week days.
Initial download of the metrics may take a while.