Fig. 1
Download original image
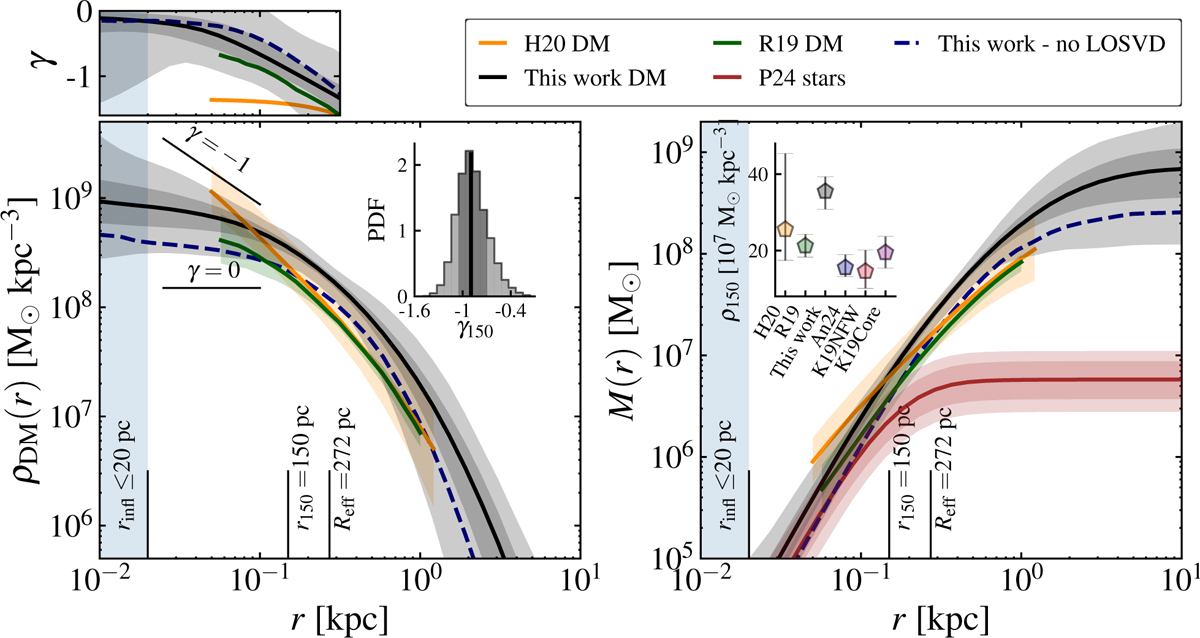
Dark matter properties. Left panel: DM density profile from the reference model (solid black line) with 1σ and 3σ confidence intervals (gray bands). The green and orange lines, together with the colored bands, show DM density profiles from R19 and H20, respectively, together with their 1σ confidence intervals. The dashed blue line is the median model obtained by fitting only the l.o.s. velocity dispersion profile in Section 2.1, with models 2.2. The vertical black line indicates the upper limit on the influence radius of the BH in Leo I (rinfl < 20 pc; P24), and the other vertical lines mark 150 pc and the effective radius Reff = 272 pc (McConnachie 2012). The small panel at the top shows the corresponding logarithmic slope γ ≡ d In ρDM/d In r. Right panel: Same as the left panel, but showing the enclosed DM mass profile. The red line indicates the median stellar mass with the 1σ and 3σ uncertainties with a red band. The inset in the left panel shows the posterior distribution on γ150. The inset in the right panel shows a compilation of ρ150 (with 1σ error bars) values from various studies: R19 and H20 (color-coded as in the main panels), Andrade et al. (2024, An24) in blue, and Kaplinghat et al. (2019) for both NFW (K19NFW) and cored (K19Core) DM models in red and purple, respectively. Kaplinghat et al. (2019) and Andrade et al. (2024) provided the values of ρ150, but no density profiles.
Current usage metrics show cumulative count of Article Views (full-text article views including HTML views, PDF and ePub downloads, according to the available data) and Abstracts Views on Vision4Press platform.
Data correspond to usage on the plateform after 2015. The current usage metrics is available 48-96 hours after online publication and is updated daily on week days.
Initial download of the metrics may take a while.