| Issue |
A&A
Volume 700, August 2025
|
|
|---|---|---|
| Article Number | A77 | |
| Number of page(s) | 9 | |
| Section | Galactic structure, stellar clusters and populations | |
| DOI | https://doi.org/10.1051/0004-6361/202555004 | |
| Published online | 07 August 2025 | |
Leo I: The classical dwarf spheroidal galaxy with the highest dark matter density
1
INAF – Osservatorio di Astrofisica e Scienza dello Spazio di Bologna,
via Gobetti 93/3,
40129
Bologna,
Italy
2
Dipartimento di Fisica e Astronomia ‘Augusto Righi’, Alma Mater Studiorum – Università di Bologna,
via Gobetti 93/2,
40129
Bologna,
Italy
3
Department of Astronomy, Indiana University,
Swain West, 727 E. 3rd Street, IN
47405
Bloomington,
USA
★ Corresponding author: This email address is being protected from spambots. You need JavaScript enabled to view it.
Received:
2
April
2025
Accepted:
16
June
2025
Abstract
Dwarf spheroidal galaxies (dSphs) are known for being strongly dark matter (DM) dominated, which makes them convenient targets for investigating the DM nature and distribution. Recently, renewed interest in the dSph Leo I has resulted from claims suggesting the presence of a central supermassive black hole, with mass estimates that challenge the typical expectations for dSphs, which are generally thought to host intermediate-mass black holes (IMBHs). However, a recent study presented new upper limits on the black hole mass that are consistent with the expected range for IMBHs, solving the concerns raised in the literature. Building on the analysis of this study, we examine in this follow-up work the DM properties of Leo I that we inferred from the most recent dynamical models presented by the authors. Our results indicate that the galaxy Leo I has the highest DM density among the classical dSphs, with a central DM density (measured at a distance of 150 pc from the galaxy center) ρ150 = 35.5−4.7+3.8 × 10⁷M⊙kpc−3. According to our model, the DM density profile has a logarithmic slope γ150 = −0.89−0.17+0.21 at 150 pc, which agrees with the literature values. At smaller distances, the DM distribution flattens into a core of constant density, with a core radius of rc = 72−32+40 pc. Combined with the small pericentric distance of the Leo I orbit in the Milky Way, the new estimate of ρ150 makes Leo I decisive in the study of the anticorrelation between pericenter and central DM density. It also suggests that the anticorrelation might be significantly steeper and more pronounced than previously estimated. Finally, despite its DM dominance, Leo I does not emerge as the most favorable target for an indirect DM detection: The inferred DM decay D and annihilation J factors, log D(0.5°)[ GeV cm 2] = 17.94−0.25+0.17 and log J(0.5°)[GeV2cm−5] = 18.13−0.18+0.17, are consistent with previous estimates and lower than the highest values measured in dSphs.
Key words: stars: kinematics and dynamics / galaxies: dwarf / galaxies: individual: Leo I / galaxies: structure / dark matter
© The Authors 2025
 Open Access article, published by EDP Sciences, under the terms of the Creative Commons Attribution License (https://creativecommons.org/licenses/by/4.0), which permits unrestricted use, distribution, and reproduction in any medium, provided the original work is properly cited.
This article is published in open access under the Subscribe to Open model. This email address is being protected from spambots. You need JavaScript enabled to view it. to support open access publication.
1 Introduction
According to the current ΛCDM cosmological model, dwarf galaxies play a crucial role in cosmic structure formation, with hierarchical evolution driven by the merging of smaller systems (Lacey & Cole 1993, 1994), and dwarf galaxies dominating the galaxy population (Marzke et al. 1998). Dwarf galaxies therefore serve as key probes for cosmology, especially given also the increasing tensions observed at these smaller scales (Bullock & Boylan-Kolchin 2017; Sales et al. 2022). Among dwarfs, dwarf spheroidal galaxies (dSphs), satellites of the Milky Way (MW), are of particular importance because of their proximity to us and their significant dark matter (DM) content (Battaglia & Nipoti 2022). These two aspects combined make dSphs important testbeds for cosmological models and excellent sites for studying DM (Gilmore et al. 2007). As an example, as a result of the lack of emission in other bands except for the optical, dSphs are ideal targets for a search for gamma-ray emission related to DM particle annihilation or decay (Bonnivard et al. 2015; Geringer-Sameth et al. 2015; Evans et al. 2016; Boddy et al. 2020; Li et al. 2021; Andrade et al. 2024).
Another example of the importance of dSphs in the study of DM is the core-cusp problem (de Blok 2010; Bullock & Boylan-Kolchin 2017). While DM-only simulations predict that halos should develop cuspy central density profiles, observational studies of low surface brightness and gas-rich dwarf galaxies suggest that their DM distributions are shallower, with central cores that have a constant density. In dSphs, determining the inner DM density is more challenging because they lack gas, which leaves only stellar kinematics as tracers of the gravitational potential. As a result, different methods and assumptions in modeling stellar orbits can lead to contrasting conclusions, which contributes to the ongoing tension on this scale. Some analyses suggested cored profiles, and others were consistent with cuspy distributions (Walker et al. 2009; Strigari et al. 2008; Amorisco & Evans 2011; Breddels & Helmi 2013; Strigari et al. 2017; Pascale et al. 2018; Read et al. 2019, hereafter R19; Hayashi et al. 2020, hereafter H20; Arroyo-Polonio et al. 2025). The origin of these cores remains debated because it may depend on the interaction between baryons and DM (Read & Gilmore 2005; Governato et al. 2012; Nipoti & Binney 2015), or it might indicate a need for alternative DM models (Governato et al. 2015; Hui et al. 2017)
Leo I is one of the most luminous and massive dSphs within the MW halo, with a stellar mass of 5.5 × 10⁶ M⊙ (McConnachie 2012). It has a regular morphology, with an elliptical structure on the plane of the sky. The ellipticity is  (Muñoz et al. 2018), with a and b the semimajor and semiminor axes, respectively. This value is comparable to that of other well-known dSphs. The heliocentric distance is 256.7 ± 13.3 kpc (Méndez et al. 2002; Bellazzini et al. 2004; Held et al. 2010; Pacucci et al. 2023), which makes Leo I the most distant dSph currently identified as a satellite of the MW. We adopt D = 256.7 kpc throughout this analysis (see Table 1 for a summary of the main structural parameters of Leo I).
The orbit of Leo I is well known. Mateo et al. (2008) provided a robust estimate of its line-of-sight (l.o.s.) velocity (vlos ≃ 282 km s−1). Sohn et al. (2013) determined the bulk velocity in proper motion (PM) for the first time, using Hubble Space Telescope (HST) images over a 5-year baseline. The tangential velocity component of the galaxy is significantly large; it remains lower than its radial component, however, which results in a fairly elliptical orbit. Sohn et al. (2013) showed that Leo I likely entered the MW about 2.33 ± 0.21 Gyr ago, having first pericentric passage approximately 1.05 ± 0.09 Gyr ago. More recently, Battaglia et al. (2022) used Gaia eDR3 data to provide a much more precise estimate of the bulk PM for Leo I, which allowed a more accurate orbital calculation. Their results indicated a very small bulk PM, which leads to a more radial orbit with a pericentric passage of  kpc. This value represents one of the smallest pericentric distances observed among the known dSphs.
For the classical dSphs orbiting the MW, an empirical anticorrelation is found between their orbital pericentric radius and their central DM density ρ150, which is conventionally measured at 150 pc from the center of the dwarf (Kaplinghat et al. 2019; Cardona-Barrero et al. 2023; Andrade et al. 2024). The physical interpretation of the existence of this anticorrelation is still debated, and it might either be explained within ΛCDM models or alternative models of DM, such as self-interacting DM (Correa et al. 2015). In any case, given its small pericentric radius and because it also is one of the dSphs with the highest DM central density (e.g. Hayashi et al. 2020; Andrade et al. 2024), the galaxy is an especially interesting object to study in this context.
Distant galaxies serve as valuable tools for investigating the distribution of DM within the outer halo of the MW. This provides essential constraints on the potential of the MW at large distances. It requires a cautious approach to analyze them, however. For example, the discrepancy between the PM estimates of Sohn et al. (2013) and Battaglia et al. (2022) may lead to different dynamical mass estimates in the outer parts of the MW (Battaglia et al. 2022). Nonetheless, this impact probably remains moderate because the overall velocity of Leo I is primarily influenced by its l.o.s. component. In any case, Battaglia et al. (2022) and Sohn et al. (2013), along with estimates from Fritz et al. (2018) and Gaia Collaboration (2018), agree on the timing of the (only) pericentric passage, which was ≃1 Gyr ago.
Leo I underwent an extended star-forming phase that was marked by recurring bursts that lasted until approximately 1 Gyr ago (Ruiz-Lara et al. 2021). This means that it is one of the youngest MW dSphs (Bellazzini et al. 2004). Notably, the latest star formation episode (1 Gyr ago) coincides with its closest approach to the MW center. This supports the hypothesis that ram pressure stripping close to the MW center quenched the star formation and captured Leo I in the transition from dIrr to dSph (Ruiz-Lara et al. 2021).
Recently, Leo I has garnered renewed interest due to the possible detection of a supermassive black hole (SMBH) at its center, as reported by Bustamante-Rosell et al. (2021). This SMBH, with a mass intriguingly comparable to the total stellar mass of the system, would challenge established models of black hole (BH) formation and evolution. To reconcile this anomaly, Pacucci et al. (2023) proposed that Leo I was initially more massive and lost a significant portion of its mass through tidal interactions with the MW, which renders the SMBH consistent with a more massive original system. This model is unconvincing, however, because it requires an unrealistic orbit and is inconsistent with the mass-metallicity relation. Recently, Pascale et al. (2024, hereafter P24) reanalyzed Leo I using the same dataset as Bustamante-Rosell et al. (2021), but employed more sophisticated models and a statistically robust approach. This reanalysis excluded a SMBH and showed that the central region of Leo I could host an intermediate-mass black hole (IMBH) at most, with an estimated upper limit on the mass of log MBH[M⊙] < 5.27 at 1σ. This suggests that the internal kinematics of Leo I is actually also consistent with a no-BH scenario.
In this work, we build upon the models presented by P24. We shift our focus toward a detailed analysis of the DM properties in Leo I because the models presented by P24 also provided accurate predictions for the DM distribution within the galaxy. Specifically, we investigate the inner structure of the DM halo of Leo I to constrain its inner slope. Furthermore, we reassess ρ150, the DM density within 150 pc, and incorporate this revised estimate into the context of established scaling relations. We provide new estimates of the decay and annihilation factors D and J, which are essential quantities in the search for gamma-ray emission from DM particle interactions.
This paper is organized as follows. In Section 2, we briefly describe the dataset and the models used by P24. In Section 3, we discuss our results and compare them with the literature. Section 4 concludes our paper.
Main structural parameters of Leo I.
2 Data and models
In this section, we briefly summarize the dataset and the dynamical models used by P24. For an extensive discussion, we refer to P24 and to their Appendix A for a comprehensive description of the Bayesian strategy and likelihood method they adopted, which we do not report here for brevity.
2.1 Data
The dataset integrates photometric and kinematic measurements. The photometric component is based on the surface brightness profile from Bustamante-Rosell et al. (2021), derived from SDSS g-band imaging. This profile extends from the central 30pc to approximately 1.5 kpc. Unlike the profiles adopted in previous studies, the surface brightness profile derived in this work probes the innermost regions of Leo I and also extends to significantly large projected radii. In the central galaxy region, crowding and completeness were also assessed using high-resolution HST images. We stress, however, that despite the applied corrections, the use of wide-field ground-based imaging for a galaxy at such a large heliocentric distance makes the computation of the surface brightness profile prone to potential biases and limitations. In particular, ground-based imaging of distant low-surface-brightness dwarf galaxies is notoriously challenging because of the extremely low surface brightness of these systems, which often approaches the limiting sky background level.
For the inner galaxy regions, the models fit the central line-of-sight velocity distributions (LOSVDs) obtained from integral field spectroscopy data. These distributions provide dynamical information extending to approximately 110 pc from the galaxy center. Finally, beyond 110 pc, the authors used the galaxy velocity dispersion profile computed from the sample of radial velocities of Leo I members from Mateo et al. (2008).
2.2 Models
The Leo I models from P24 are based on analytic distribution functions (DFs) depending on the action integrals J (Binney 2014; Cole & Binney 2017). In their analysis, Leo I is represented as a multicomponent galaxy, with DF-based stellar and DM components, and an optional central BH with a mass MBH described by a Keplerian fixed contribution to the total potential
 (1)
(1)
where Φ★, ΦDM, and ΦBH are the stellar, DM, and BH potentials. For stars and DM, the authors solved for the Poisson equation
 (2)
(2)
where i can be either stars (i = ★) or DM (i = DM). The DF of each component fi(J) is given by
![Mathematical equation: \begin{split} \fJi =\ & \fni\frac{\Mi}{(2\pi\Ji)^3} \biggl[1 - \beta\frac{\Jci}{\hJi} + \biggl(\frac{\Jci}{\hJi}\biggr)^2\biggr]^{-\frac{\Gammai}{2}} \\ & \times\biggl[1 + \biggl(\frac{\Ji}{\hJi}\biggr)^{\etai}\biggr]^{\frac{\Gammai}{\etai}} \biggl[1 + \biggl(\frac{\gJi}{\Ji}\biggr)^{\etai}\biggr]^{\frac{\Gammai-\Bi}{\etai}} \times \\ & \times e^{-\bigl[\frac{\gJi}{\Jti}\bigr]^{\alphai}}, \end{split}](/articles/aa/full_html/2025/08/aa55004-25/aa55004-25-eq10.png) (3)
(3)
where
 (4)
(4)
and
 (5)
(5)
This DF framework allows for a variety of density profiles, including cored or cuspy density profiles, with different inner and outer velocity distributions. Mi is the total mass of the target component, and Jc,i, Ji, and Jt,i are action scales that set the transition between different regimes in the action space (details are provided by Vasiliev 2019 and P24). Γi, Bi, and ηi are dimensionless parameters related to the inner and outer slopes of the density profile and the sharpness of the transition between the two. The dimensionless parameters gr,i and hr,i, with allowed ranges 0 < gr,i < 3 and 0 < hr,i < 3, are related to the velocity distributions of the model. The models are spherically symmetric since the DFs (3) depend on the vertical (Jz) and azimuthal (Jφ) actions only through the angular momentum modulus  .
.
In Table 2, we provide a convenient summary of the inference on the free model parameters from P24, together with the lower and upper bounds of the uniform prior distributions adopted in their Bayesian analysis. Here, it is sufficient to recall that confidence intervals on model parameters and any derived quantity are computed as percentiles from the corresponding marginalized distributions. Specifically, the median model corresponds to the 50th percentile, the 1σ confidence intervals are computed using the 16th and 84th percentiles, and the 3σ confidence intervals are computed as the 0.15th and 99.85th percentiles.
3 Results
In this section, we present and discuss our results, which are based on a further analysis of the models of P24. P24 only focused on the central BH properties, but the same models also account for the presence of DM (see Section 2.2), to which we shift our attention here.
3.1 Dark matter density distribution
In Fig. 1, we present an overview of the DM properties of Leo I based on our analysis. The left panel shows the median DM density profile computed from the posterior distribution presented by P24 with the 1σ and 3σ confidence intervals, and, for comparison, the 1σ profiles estimated by R19 and H20. A vertical solid line to the left indicates the upper limit of the BH influence radius1 estimated by P24. The small panel to the top shows the corresponding logarithmic slope  profiles. The right panel displays the galaxy’s enclosed DM mass distribution, and, for reference, we also include the stellar mass profile resulting from our fit. According to our analysis, Leo I is confirmed as a DM-dominated galaxy, with a dynamical-to-stellar mass ratio (Mdyn/M★) of ≃6.4 within Reff, and ≃32.5 within the stellar truncation radius rt = 940 pc. These ratios correspond to dynamical masses of approximately
  within Reff and
  within rt (see Table 3).
H20 analyzed the DM density distribution of all the classical dSphs using axisymmetric Jeans models. In their approach, both stars and DM are flattened, and they fit the radial distribution of stars alongside the l.o.s. velocity dispersion of stars along the major, minor, and an intermediate axes. The DM halo was represented with a generalized axisymmetric Hernquist profile (Hernquist 1990; Zhao 1996). With this model, halos can be described with either cuspy central profiles or cored profiles, which provides a smooth transition between these configurations. In their specific analysis, H20 reported a general preference for cuspy profiles in most of the dSphs they studied, and Leo I had the steepest inner slope (although with considerable uncertainties) with respect to better constrained cusps such as those found in Draco or Ursa Minor by the authors. R19 employed a nonparametric spherical Jeans approach via the code GravSphere (Read & Steger 2017) to examine inner DM densities in a diverse sample of dwarf galaxies, including both dSphs and dwarf irregulars with varied star formation histories. Their results also indicated a preference for a cuspy profile in Leo I. In addition to the aforementioned studies, in an earlier work, Koch et al. (2007) investigated the DM density profile of Leo I. They did not systematically explore the parameter space, however, and the quality of the available kinematic data prevented the authors from drawing firm conclusions regarding whether a cuspy or cored DM profile is preferred, with both being compatible with the data.
In our analysis, we found that the DM density profile of Leo I asymptotically approaches a median slope of γ = 0 for small distances (top left panel of Fig. 1), indicating the presence of a core. This result is in apparent contrast with the cuspy profiles proposed in previous studies. In particular, when compared to the sample of H20, our results diverge significantly because their model predicted a slope of  , which is even steeper than a pure Navarro et al. (1996, hereafter NFW) with γ = −1 and indicates a strongly cusped profile. By comparison, our results agree better with those of R19. Although R19 reported a cuspy profile, their spatial coverage of Leo I was more limited than ours, and within the same radial range, our results are compatible with theirs. As a reference, R19 measured a slope of
  at r = 150 pc, which is consistent within 1σ with our result of
  . To provide a clear representation of the γ150 parameter, we show its posterior in the small inset of Fig. 1. The core-like nature of our profile, with a slope approaching zero, only appears in the very central regions, at distances smaller than or comparable to the innermost data points used by R19. The top left panel of Fig. 1 also reveals that on the scales of rinfl, although the median model suggests a central slope γ close to zero, the distribution of γ exhibits a highly asymmetric tail extending toward γ ≃ −1, with even smaller values at 3σ. This feature is particularly intriguing, and it arises from the inclusion of a central BH in the models, whose impact on the DM distribution is degenerate with, since it also produces a cusp for r → 0.
We provide a quantitative measure of the core extent in the central regions of the DM halo defining its core radius, rc, as the distance from the galaxy center at which the logarithmic slope of the DM density profile is γ = −0.5. We find  pc, which is indeed smaller than 150 pc. This further supports the consistency of our results with the findings of R19, and it is marginally larger than the BH maximum influence radius of 20 pc. Additionally, the DM slope at the radius of influence is
  , which again shows that only the very innermost regions tend to a cored structure. These quantities are also reported in Table 3 for reference.
The DM density profiles inferred from our models of Leo I consistently indicate a higher normalization at almost all radii when compared to previous profiles in the literature. This discrepancy is especially pronounced at 150 pc. This reference distance is used to assess the amount of DM in the center of dSphs, and thus is a scale that is well constrained by several studies. When compared to H20, who provided a comprehensive estimate of ρ150 for all classical dSphs, Leo I emerges as the most DM-dense classical dSph. Although H20 also reported that Leo I has the highest ρ150, our analysis yields a value that is almost twice as high, but still consistent within 1σ. This underlines its status as the densest dSph. The small inset in the right panel of Fig. 1 presents a collection of ρ150 from various studies, including those by H20 and R19, along with additional estimates from Kaplinghat et al. (2019) and Andrade et al. (2024), with Kaplinghat et al. (2019) providing two measurements based on different DM models, one assuming a core and the other a cusp. This comparison highlights that the values from H20 have a considerably higher uncertainty than all other studies and that our measurement indicates a DM density at 150 pc that is at least twice as high as any previous estimate.
A notable aspect of this discrepancy is that all studies, except for P24, agree with each other within the error bars. Interestingly, these works are consistent even though different methods were employed. For instance, H20 used flattened models and computed three separate profiles along the minor, major, and intermediate axes of the galaxy, fitting them with axisymmetric Jeans models. Both R19 and Kaplinghat et al. (2019) fit higher moments of the l.o.s. velocity distribution with spherical Jeans models, while Andrade et al. (2024) adopted DF-based models, as we did here.
The main difference between the other studies and ours is the employed dataset. While all analyses relied on the l.o.s. velocity data from Mateo et al. (2008), P24 incorporated an additional dataset: the central LOSVDs data from Bustamante-Rosell et al. (2021). In Fig. 2 we present the velocity dispersion profile derived by P24 (black squares with error bars) alongside the median l.o.s. velocity dispersion model and confidence intervals from P24. For comparison, we also show the velocity dispersion profiles from H20 as yellow points. The profiles from H20 and P24 align closely for r > 150 pc, while they diverge within 150 pc, where P24 incorporate the central LOSVDs into the fit. These LOSVDs exhibit velocity dispersions that reach up to 12 km s−1 (shown as small black points in Fig. 2), a value higher than the inner profile from H20, which stabilizes around 8 km s−1. The bottom panel of Fig. 2 shows the symmetrized anisotropy parameter β̃, defined as (Read et al. 2006)
 (6)
(6)
with σr and σθ the radial and tangential velocity dispersions, respectively. The parameter β̃ is related to the well-known anisotropy parameter β (Binney & Tremaine 2008) by
 (7)
(7)
The advantage of using β̃ over β is that β̃ is symmetric between −1 and 1. β̃ measures the tangential anisotropy when it lies between −1 and 0 (whereas β < 0). Both β̃ and β are equal to zero for isotropy, and both β̃ and β correspond to radial anisotropy in the range between zero and one.
We believe that the inclusion of the additional LOSVD dataset is the primary reason for the higher inferred DM density. To test this hypothesis, we repeated the identical Bayesian model-data comparison performed by P24, but without the central LOSVDs. The resulting median DM density, mass, and logarithmic slope profiles are reported in Fig. 1. As shown, the DM density profile is fully consistent with those derived in other studies, and so is the value of ρ150. In this model, the dynamical mass within Reff and rt decreases by nearly a factor of two, becoming  , respectively. These revised values agree with all previous estimates, including that by Koch et al. (2007). While Koch et al. (2007) provided an estimate of the DM mass within rt and we report the dynamical mass within rt, the system at this radius is effectively DM dominated, making the two measurements directly comparable.
This behavior can be explained qualitatively as follows, although the interplay between the free model parameters is not necessarily straightforward. The central LOSVDs, whose dispersions are particularly high when compared to the outer l.o.s. velocity dispersion profile, increase the amount of mass required in these regions. This leads to an overall increase in the DM density for a fixed anisotropy. At the same time, to fit the outer l.o.s. velocity dispersion profile, a strong radial anisotropy in the outer regions is favored (see the bottom panel of Fig. 2) because radial anisotropy results in an increase in the velocity dispersion along the radial component, which in turn decreases the l.o.s. velocity dispersion profile in the outskirts (Pascale et al. 2019).
The residual differences between our inferred DM density profiles and those reported in previous studies may be attributed to the use of a slightly different surface brightness or stellar density profiles by various authors. As discussed in Section 2.1, the surface brightness profiles commonly adopted in the modeling of dSphs are derived from ground-based observations, which inevitably carry systematic biases and limitations. Moreover, unlike other works where these profiles served as fixed inputs to the models, in our approach, they were fit simultaneously with the kinematic data to properly account for observational uncertainties. This may also contribute to these discrepancies.
The large 1σ confidence levels in the mass and density (and, thus, ρ150) distributions reported by H20 probably arise from their use of flattened models, which allow for a marginalization over the flattening of the DM halo. This approach likely increases the uncertainty in the inferred density estimates and results in the broader error ranges measured in their study.
Inference on the free model parameters.
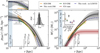 |
Fig. 1 Dark matter properties. Left panel: DM density profile from the reference model (solid black line) with 1σ and 3σ confidence intervals (gray bands). The green and orange lines, together with the colored bands, show DM density profiles from R19 and H20, respectively, together with their 1σ confidence intervals. The dashed blue line is the median model obtained by fitting only the l.o.s. velocity dispersion profile in Section 2.1, with models 2.2. The vertical black line indicates the upper limit on the influence radius of the BH in Leo I (rinfl < 20 pc; P24), and the other vertical lines mark 150 pc and the effective radius Reff = 272 pc (McConnachie 2012). The small panel at the top shows the corresponding logarithmic slope γ ≡ d In ρDM/d In r. Right panel: Same as the left panel, but showing the enclosed DM mass profile. The red line indicates the median stellar mass with the 1σ and 3σ uncertainties with a red band. The inset in the left panel shows the posterior distribution on γ150. The inset in the right panel shows a compilation of ρ150 (with 1σ error bars) values from various studies: R19 and H20 (color-coded as in the main panels), Andrade et al. (2024, An24) in blue, and Kaplinghat et al. (2019) for both NFW (K19NFW) and cored (K19Core) DM models in red and purple, respectively. Kaplinghat et al. (2019) and Andrade et al. (2024) provided the values of ρ150, but no density profiles. |
DM and stellar parameters computed from the posterior of P24.
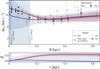 |
Fig. Kinematic properties of Leo I. Top panel: median l.o.s. stellar velocity dispersion profile from P24 (solid red line). The shaded regions represent the 1σ and 3σ confidence intervals. The solid blue line and light blue band instead show the median l.o.s. velocity dispersion and the 3σ band obtained by fitting the same dataset as P24, except for the central LOSVDs. The black squares with error bars depict the l.o.s. velocity dispersion from P24 computed with Mateo et al. (2008) data, and the smaller black squares in the inner region show the dispersion of the LOSVDs fitted by P24 (see their Figure 2). For comparison, l.o.s. velocity dispersion data from H20 along the major axis of Leo I are shown as yellow triangles with error bars. The vertical light blue bands mark the regions within the maximum influence radius (rinfl ≤ 20 pc) of the BH in Leo I, and within 150 pc. Bottom panel: symmetrized stellar anisotropy parameter profile derived from the posterior distribution from P24, including 1σ and 3σ confidence intervals. As in the top panel, the red curve and band correspond to the models from P24, and the blue curve and band show the models obtained by fitting the same dataset as P24, except for the LOSVDs. |
3.2 Central density versus pericentric distance anticorrelation
The advent of Gaia Data Release 2 (GDR2) has provided precise proper motion measurements of the bulk velocity of dSphs, which significantly improved the reconstruction of their orbits within the Milky Way potential. Based on this, several studies identified a potential anticorrelation between the pericentric distance, rperi, and the central DM density, ρ150, of the classical dSphs (Kaplinghat et al. 2019; Cardona-Barrero et al. 2023). This trend implies that dSphs that pass closer to the Galactic center tend to have a higher central DM density. The existence of this anticorrelation remains highly debated, however, and its underlying physical origin is still uncertain. A few mechanisms have been proposed to explain it.
For instance, the so-called survivor bias model (H20) posits that low-density dSphs with small pericentric distances have been disrupted by tidal interactions (see also Blaña et al. 2025), which left only the densest systems behind. This scenario fails to explain why galaxies with high ρ150 and large rperi are absent, however. Instead, some authors suggested that the anticorrelation might arise naturally in alternative DM scenarios as a result of different properties of DM in nonstandard scenarios. For instance, the anticorrelation might arise as a consequence of tidal-stripping-driven gravothermal core collapse of the satellite dwarf halos (Correa et al. 2015) in the context of self-interacting DM (SIDM). Others argued that the anticorrelation is merely an artifact of incompleteness or biased parameter estimates and not a genuine physical relation. The anticorrelation is particularly controversial because no similar trend has been observed in the population of ultrafaint dwarf galaxies, which are also satellites of the Milky Way.
In a recent work, Cardona-Barrero et al. (2023) gathered different sets of central DM densities and pericentric distances from various studies (Kaplinghat et al. 2019; Hayashi et al. 2020; Battaglia et al. 2022) and explored multiple combinations of these datasets to assess the statistical occurrence of the proposed anticorrelation. Their analysis also incorporated rperi estimates that accounted for the time-dependent Milky Way potential, including the influence of the Large Magellanic Cloud infall, in order to marginalize and examine potential biases arising from the use of specific datasets and different assumptions. The results indicate that the anticorrelation is statistically significant in only 12% of the analyzed dataset combinations, suggesting that evidence for this relation is apparently weak and highly sensitive to the choice of datasets.
In Fig. 3, we show an illustrative example of the 24 ρ150-rperi combinations explored by Cardona-Barrero et al. (2023), along with their fitted anticorrelation (the linear fit proposed by the authors is in log-log space). While this is not the case where the anticorrelation is intrinsically the most significant, it remains detectable at the 1σ level according to Cardona-Barrero et al. (2023). Our revised ρ150 estimate (blue point) further strengthens this trend by shifting the innermost data point upward. This is a particularly striking aspect, as it significantly enhances the anticorrelation and makes it much more pronounced. This adjustment may increase the statistical significance of the anticorrelation in dataset combinations that previously showed weak or no evidence for it.
3.3 J and D factors
The J and D factors are key quantities for indirect DM detection experiments. These experiments focus on searching for gamma-ray emission resulting from DM annihilation (J factor) and decay (D factor) within systems with possibly a large amount of DM (e.g. Zeldovich et al. 1980; Turner et al. 1984). In this respect, dSphs are of particular interest because they are DM dominated, but also they lack other sources in the gamma-ray band. Moreover, they are relatively close to Earth. To date, no significant gamma-ray excess has been detected from dSphs, and all constraints on DM particle properties are based on nondetections. These nondetections were used to place upper limits on the annihilation cross-sections and particle masses of DM candidates, and some studies ruled out certain classes of particles as viable explanations for the observed data (Ackermann et al. 2015; Geringer-Sameth et al. 2015; Hoof et al. 2020; Di Mauro et al. 2022; Crnogorčević & Linden 2024). Despite the absence of direct signals, these galaxies remain prime targets for future DM searches.
The J factor contributes to determine the probability of detecting a gamma-ray signal resulting from the annihilation of DM particles. Similarly, the D factor relates to the probability of gamma-ray emission due to the decay of DM particles. These factors are defined as (Evans et al. 2016)
 (8)
(8)
and
 (9)
(9)
where d is the distance of the galaxy, while θ is the angular distance measured from the center of the galaxy, z is the l.o.s., and R is the distance from the center of the galaxy on the plane of the sky. It is essential to note that the J and D factors are determined by two main factors: the DM density profile of the galaxy, and its distance from the Earth. Leo I is particularly interesting as it is the most DM-dense dSphs, but also the most distant. This leads to some trade-offs in terms of its DM signature.
Fig. 4 shows the profiles of the J and D factors for Leo I as a function of the angular distance from the galaxy center, computed based on the posterior distributions from P24. Typically, J and D factors are calculated within a region of 0.5 deg, which corresponds to the resolution of the Fermi LAT telescope. In Fig. 4, the small insets also provide comparisons with values from previous studies. While the new estimate of the D is generally consistent within the error bars with previous estimates, the values of the J factor differ significantly. Our new estimate of the J factor is more than 1σ higher than the values reported by Hayashi et al. (2016, 2020) and is marginally compatible with Geringer-Sameth et al. (2015). This discrepancy in the J factor is likely due to the quadratic dependence on the DM density profile, which may accentuate differences in the J factor for a given distance from the galaxy center more than in the D factor.
Compared to other dwarf galaxies, our new estimate of the J factor shows that Leo I is a more favorable target than previously suggested. It is still not one of the most promising dSphs for DM searches, however. Even though recent studies showed that galaxies such as Fornax (Pascale et al. 2019) and Sculptor (Arroyo-Polonio et al. 2025) exhibit systematically higher J and D factors than previously estimated (see also Nipoti et al. 2024), other galaxies such as Draco and Ursa Minor remain among the most favorable targets for DM detection (see, for instance, Geringer-Sameth et al. 2015).
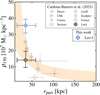 |
Fig. 3 rperi – ρ150 anticorrelation for the eight classical dSphs from Cardona-Barrero et al. (2023). The central ρ150 densities are taken from Kaplinghat et al. (2019), and the pericentric distances are taken from Battaglia et al. (2022). The orange band represents the fit to the gray and black points as derived by Cardona-Barrero et al. (2023). The blue point corresponds to the measurement for Leo I, with ρ150 derived in this work. |
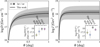 |
Fig. 4 Left panel: DM decay D factor profiles computed from the posterior distribution presented from P24 (solid black line) together with the 1σ and 3σ bands. Right panel: same as the left panel, but showing the J-factor profile. The small insets in the bottom panels show the model D and J factors at an aperture of 0.5° compared to values from the literature: Hayashi et al. (2016, H16) in yellow, H20 in blue and Geringer-Sameth et al. (2015, GS15)in purple. |
4 Conclusions
This study provided a revised characterization of the DM properties of the dSph Leo I. Building on the results of P24, we conducted an in-depth analysis of the DM distribution in the galaxy. The models we presented utilized the most recent dynamical models based on f (J) DFs and fit the central galaxy LOSVDs from Bustamante-Rosell et al. (2021), as well as photometric and outer spectroscopic measurements from Bustamante-Rosell et al. (2021) and Mateo et al. (2008). While P24 primarily investigated the presence of a possible IMBH in Leo I, we shifted the attention to the DM properties inferred from the same models. According to our new estimate, Leo I is the classical dSph known in the MW with the highest DM density. As a reference, we provide a central DM density of  at 150 pc from the galaxy center.
This new estimate has important implications for the anticorrelation between the central DM density and the pericentric distance of MW satellites, whose physical origin remains an open question. For instance, DM-only simulations suggest a strong anticorrelation (Hayashi et al. 2016), whereas hydrodynamical simulations incorporating baryonic effects indicate that the MW disk potential can significantly alter satellite densities, leading to lower densities in satellites with smaller pericenters (Robles et al. 2019). While Cardona-Barrero et al. (2023) recently demonstrated that the existence and strength of this anticorrelation depend on the dataset used (with a clear signal emerging only in certain cases), our revised and higher estimate of the DM density of Leo I could strengthen the observed anticorrelation.
Our results for the central DM density of Leo I are also relevant to SIDM models. Correa (2021) explored models of SIDM with a velocity-dependent cross section and reported that Leo I favors a larger SIDM cross-section than found for other dSphs with a similar velocity dispersion. Using our estimate of ρ150 for Leo I, which is higher than that of Kaplinghat et al. (2019), which was used by Correa (2021), this conclusion is strengthened because more efficient gravothermal collapse is required to produce a higher central DM density. Ebisu et al. (2022) show that SIDM models with a velocity-independent cross-section are hard to reconcile with the observed ρ150-rperi anticorrelation because they predict dwarf galaxies with lower ρ150 than observed in classical dSphs, with Leo I being one of the galaxies with the strongest discrepancy: This discrepancy is exacerbated if the central DM density of Leo I is as high as estimated in our work.
We also explored the structure of the DM distribution in the context of the core-cusp problem. Our results indicate that the internal kinematics of Leo I is compatible with a central DM core. We measured a core size (the distance from the galaxy center where the log slope γ = −0.5) of  , which is larger than the maximum sphere of influence of a putative IMBH (rinfl = 20 pc). We measured a logarithmic slope
  . At larger radii, which correspond to the innermost regions covered by data in several studies from the literature, the DM density profile exhibits a mild cusp, with a logarithmic slope of
  at 150 pc.
Finally, we provided new estimates of the J and D factors for Leo I. We obtained log D(0.5°)[GeV cm−2] =  and log J(0.5°)[GeV2 cm−5] =
  . Although these values are higher than some previous estimates, they remain within the range of literature values for Leo I. Thus, despite its status as a highly DM-dominated system, Leo I does not emerge as one of the most promising dSph targets for indirect DM detection via gamma-ray emission.
A key difficulty in determining the surface brightness profiles of dSph galaxies lies in the use of wide-field groundbased imaging, where issues such as crowding, background subtraction, and the trade-off between field of view and spatial resolution, hence uniform coverage of the target, become significant. As a result, dynamical models relying on these profiles inherently carry a level of uncertainty associated with how the profiles themselves are constructed. Euclid will substantially mitigate these limitations: Its imager combines a 0.57 deg field of view with spatial resolution (FWHM) ≃0.14 arcsec in VIS (I band) and ≃0.45 arcsec in NISP (Y, J, H bands; Cuillandre et al. 2025), and a diffraction-limited PSF, enabling uniform, background-limited photometry down to an I-band magnitude of ≃30 mag arcsec−2 (Hunt et al. 2025). For Leo I, this translates into (i) a continuous coverage of the target beyond 40 arcsec in a single pointing; (ii) lower crowding and thus deeper stellar photometry; and (iii) self-consistent photometric calibration on a single detector, which minimizes completeness variations. Euclid is therefore expected to revolutionize the field of dynamical modeling by providing unprecedentedly high-quality data for Leo I, as well as for dSph galaxies and low surface brightness galaxies in general.
Acknowledgements
We are grateful to the referee, Prof. G. Gilmore, for the useful comments and feedback that helped improve the quality of the paper. We also thank Dr. Francesca Annibali for her constructive feedback and suggestions. This paper is supported by the Italian Research Center on High Performance Computing Big Data and Quantum Computing (ICSC), project funded by European Union - NextGenerationEU - and National Recovery and Resilience Plan (NRRP) - Mission 4 Component 2 within the activities of Spoke 3 (Astrophysics and Cosmos Observations). The research activities described in this paper have been co-funded by the European Union - NextGeneration EU within PRIN 2022 project no. 20229YBSAN - Globular clusters in cosmological simulations and in lensed fields: from their birth to the present epoch.
References
- Ackermann, M., Albert, A., Anderson, B., et al. 2015, Phys. Rev. Lett., 115, 231301 [NASA ADS] [CrossRef] [Google Scholar]
- Amorisco, N. C., & Evans, N. W. 2011, MNRAS, 411, 2118 [Google Scholar]
- Andrade, K. E., Kaplinghat, M., & Valli, M. 2024, MNRAS, 532, 4157 [NASA ADS] [CrossRef] [Google Scholar]
- Arroyo-Polonio, J. M., Pascale, R., Battaglia, G., et al. 2025, A&A, 699, A347 [NASA ADS] [CrossRef] [EDP Sciences] [Google Scholar]
- Battaglia, G., & Nipoti, C. 2022, Nat. Astron., 6, 659 [NASA ADS] [CrossRef] [Google Scholar]
- Battaglia, G., Taibi, S., Thomas, G. F., & Fritz, T. K. 2022, A&A, 657, A54 [NASA ADS] [CrossRef] [EDP Sciences] [Google Scholar]
- Bellazzini, M., Gennari, N., Ferraro, F. R., & Sollima, A. 2004, MNRAS, 354, 708 [NASA ADS] [CrossRef] [Google Scholar]
- Binney, J. 2014, MNRAS, 440, 787 [Google Scholar]
- Binney, J., & Tremaine, S. 2008, Galactic Dynamics, 2nd edn. (Princeton University Press) [Google Scholar]
- Blaña, M., Puzia, T. H., Ordenes-Briceño, Y., et al. 2025, A&A, 699, A69 [NASA ADS] [CrossRef] [EDP Sciences] [Google Scholar]
- Boddy, K. K., Kumar, J., Pace, A. B., Runburg, J., & Strigari, L. E. 2020, Phys. Rev. D, 102, 023029 [Google Scholar]
- Bonnivard, V., Combet, C., Daniel, M., et al. 2015, MNRAS, 453, 849 [Google Scholar]
- Breddels, M. A., & Helmi, A. 2013, A&A, 558, A35 [NASA ADS] [CrossRef] [EDP Sciences] [Google Scholar]
- Bullock, J. S., & Boylan-Kolchin, M. 2017, ARA&A, 55, 343 [Google Scholar]
- Bustamante-Rosell, M. J., Noyola, E., Gebhardt, K., et al. 2021, ApJ, 921, 107 [NASA ADS] [CrossRef] [Google Scholar]
- Cardona-Barrero, S., Battaglia, G., Nipoti, C., & Di Cintio, A. 2023, MNRAS, 522, 3058 [CrossRef] [Google Scholar]
- Cole, D. R., & Binney, J. 2017, MNRAS, 465, 798 [Google Scholar]
- Correa, C. A. 2021, MNRAS, 503, 920 [NASA ADS] [CrossRef] [Google Scholar]
- Correa, C. A., Wyithe, J. S. B., Schaye, J., & Duffy, A. R. 2015, MNRAS, 452, 1217 [CrossRef] [Google Scholar]
- Crnogorčević, M., & Linden, T. 2024, Phys. Rev. D, 109, 083018 [Google Scholar]
- Cuillandre, J. C., Bertin, E., Bolzonella, M., et al. 2025, A&A, 697, A6 [Google Scholar]
- de Blok, W. J. G. 2010, Adv. Astron., 2010, 789293 [CrossRef] [Google Scholar]
- Di Mauro, M., Stref, M., & Calore, F. 2022, Phys. Rev. D, 106, 123032 [Google Scholar]
- Ebisu, T., Ishiyama, T., & Hayashi, K. 2022, Phys. Rev. D, 105, 023016 [Google Scholar]
- Evans, N. W., Sanders, J. L., & Geringer-Sameth, A. 2016, Phys. Rev. D, 93, 103512 [Google Scholar]
- Fritz, T. K., Battaglia, G., Pawlowski, M. S., et al. 2018, A&A, 619, A103 [NASA ADS] [CrossRef] [EDP Sciences] [Google Scholar]
- Gaia Collaboration (Helmi, A., et al.) 2018, A&A, 616, A12 [NASA ADS] [CrossRef] [EDP Sciences] [Google Scholar]
- Geringer-Sameth, A., Koushiappas, S. M., & Walker, M. 2015, ApJ, 801, 74 [NASA ADS] [CrossRef] [Google Scholar]
- Gilmore, G., Wilkinson, M. I., Wyse, R. F. G., et al. 2007, ApJ, 663, 948 [Google Scholar]
- Governato, F., Zolotov, A., Pontzen, A., et al. 2012, MNRAS, 422, 1231 [Google Scholar]
- Governato, F., Weisz, D., Pontzen, A., et al. 2015, MNRAS, 448, 792 [NASA ADS] [CrossRef] [Google Scholar]
- Hayashi, K., Ichikawa, K., Matsumoto, S., et al. 2016, MNRAS, 461, 2914 [Google Scholar]
- Hayashi, K., Chiba, M., & Ishiyama, T. 2020, ApJ, 904, 45 [NASA ADS] [CrossRef] [Google Scholar]
- Held, E. V., Gullieuszik, M., Rizzi, L., et al. 2010, MNRAS, 404, 1475 [NASA ADS] [Google Scholar]
- Hernquist, L. 1990, ApJ, 356, 359 [Google Scholar]
- Hoof, S., Geringer-Sameth, A., & Trotta, R. 2020, J. Cosmology Astropart. Phys., 2020, 012 [CrossRef] [Google Scholar]
- Hui, L., Ostriker, J. P., Tremaine, S., & Witten, E. 2017, Phys. Rev. D, 95, 043541 [NASA ADS] [CrossRef] [Google Scholar]
- Hunt, L. K., Annibali, F., Cuillandre, J. C., et al. 2025, A&A, 697, A9 [NASA ADS] [CrossRef] [EDP Sciences] [Google Scholar]
- Irwin, M., & Hatzidimitriou, D. 1995, MNRAS, 277, 1354 [NASA ADS] [CrossRef] [Google Scholar]
- Kaplinghat, M., Valli, M., & Yu, H.-B. 2019, MNRAS, 490, 231 [NASA ADS] [CrossRef] [Google Scholar]
- Koch, A., Wilkinson, M. I., Kleyna, J. T., et al. 2007, ApJ, 657, 241 [Google Scholar]
- Lacey, C., & Cole, S. 1993, MNRAS, 262, 627 [NASA ADS] [CrossRef] [Google Scholar]
- Lacey, C., & Cole, S. 1994, MNRAS, 271, 676 [Google Scholar]
- Li, S., Liang, Y.-F., & Fan, Y.-Z. 2021, Phys. Rev. D, 104, 083037 [Google Scholar]
- Marzke, R. O., da Costa, L. N., Pellegrini, P. S., Willmer, C. N. A., & Geller, M. J. 1998, ApJ, 503, 617 [NASA ADS] [CrossRef] [Google Scholar]
- Mateo, M., Olszewski, E. W., & Walker, M. G. 2008, ApJ, 675, 201 [NASA ADS] [CrossRef] [Google Scholar]
- McConnachie, A. W. 2012, AJ, 144, 4 [Google Scholar]
- Méndez, B., Davis, M., Moustakas, J., et al. 2002, AJ, 124, 213 [CrossRef] [Google Scholar]
- Muñoz, R. R., Côté, P., Santana, F. A., et al. 2018, ApJ, 860, 66 [CrossRef] [Google Scholar]
- Navarro, J. F., Frenk, C. S., White, S. D. M., et al. 1996, ApJ, 462, 563 [CrossRef] [Google Scholar]
- Nipoti, C., & Binney, J. 2015, MNRAS, 446, 1820 [NASA ADS] [CrossRef] [Google Scholar]
- Nipoti, C., Pascale, R., & Arroyo-Polonio, J. M. 2024, arXiv e-prints [arXiv:2411.05084] [Google Scholar]
- Pacucci, F., Ni, Y., & Loeb, A. 2023, ApJ, 956, L37 [NASA ADS] [CrossRef] [Google Scholar]
- Pascale, R., Posti, L., Nipoti, C., & Binney, J. 2018, MNRAS, 480, 927 [Google Scholar]
- Pascale, R., Binney, J., Nipoti, C., & Posti, L. 2019, MNRAS, 488, 2423 [NASA ADS] [CrossRef] [Google Scholar]
- Pascale, R., Nipoti, C., Calura, F., & Della Croce, A. 2024, A&A, 684, L19 [NASA ADS] [CrossRef] [EDP Sciences] [Google Scholar]
- Read, J. I., & Gilmore, G. 2005, MNRAS, 356, 107 [NASA ADS] [CrossRef] [Google Scholar]
- Read, J. I., & Steger, P. 2017, MNRAS, 471, 4541 [Google Scholar]
- Read, J. I., Wilkinson, M. I., Evans, N. W., Gilmore, G., & Kleyna, J. T. 2006, MNRAS, 366, 429 [NASA ADS] [CrossRef] [Google Scholar]
- Read, J. I., Walker, M. G., & Steger, P. 2019, MNRAS, 484, 1401 [NASA ADS] [CrossRef] [Google Scholar]
- Robles, V. H., Kelley, T., Bullock, J. S., & Kaplinghat, M. 2019, MNRAS, 490, 2117 [Google Scholar]
- Ruiz-Lara, T., Gallart, C., Monelli, M., et al. 2021, MNRAS, 501, 3962 [NASA ADS] [CrossRef] [Google Scholar]
- Sales, L. V., Wetzel, A., & Fattahi, A. 2022, Nat. Astron., 6, 897 [NASA ADS] [CrossRef] [Google Scholar]
- Sohn, S. T., Besla, G., van der Marel, R. P., et al. 2013, ApJ, 768, 139 [NASA ADS] [CrossRef] [Google Scholar]
- Strigari, L. E., Bullock, J. S., Kaplinghat, M., et al. 2008, Nature, 454, 1096 [NASA ADS] [CrossRef] [Google Scholar]
- Strigari, L. E., Frenk, C. S., & White, S. D. M. 2017, ApJ, 838, 123 [NASA ADS] [CrossRef] [Google Scholar]
- Turner, M. S., Steigman, G., & Krauss, L. M. 1984, Phys. Rev. Lett., 52, 2090 [Google Scholar]
- Vasiliev, E. 2019, MNRAS, 482, 1525 [Google Scholar]
- Walker, M. G., Mateo, M., Olszewski, E. W., et al. 2009, ApJ, 704, 1274 [Google Scholar]
- Zeldovich, Y. B., Klypin, A., Khlopov, M. Y., & Chechetkin, V. M. 1980, Sov. J. Nucl. Phys., 31, 664 [NASA ADS] [Google Scholar]
- Zhao, H. 1996, MNRAS, 278, 488 [Google Scholar]
The BH influence radius is defined as the distance from the galaxy center where the l.o.s. velocity dispersion is equal to the BH circular velocity (Binney & Tremaine 2008).
All Tables
All Figures
|
Fig. 1 Dark matter properties. Left panel: DM density profile from the reference model (solid black line) with 1σ and 3σ confidence intervals (gray bands). The green and orange lines, together with the colored bands, show DM density profiles from R19 and H20, respectively, together with their 1σ confidence intervals. The dashed blue line is the median model obtained by fitting only the l.o.s. velocity dispersion profile in Section 2.1, with models 2.2. The vertical black line indicates the upper limit on the influence radius of the BH in Leo I (rinfl < 20 pc; P24), and the other vertical lines mark 150 pc and the effective radius Reff = 272 pc (McConnachie 2012). The small panel at the top shows the corresponding logarithmic slope γ ≡ d In ρDM/d In r. Right panel: Same as the left panel, but showing the enclosed DM mass profile. The red line indicates the median stellar mass with the 1σ and 3σ uncertainties with a red band. The inset in the left panel shows the posterior distribution on γ150. The inset in the right panel shows a compilation of ρ150 (with 1σ error bars) values from various studies: R19 and H20 (color-coded as in the main panels), Andrade et al. (2024, An24) in blue, and Kaplinghat et al. (2019) for both NFW (K19NFW) and cored (K19Core) DM models in red and purple, respectively. Kaplinghat et al. (2019) and Andrade et al. (2024) provided the values of ρ150, but no density profiles. |
| In the text | |
|
Fig. Kinematic properties of Leo I. Top panel: median l.o.s. stellar velocity dispersion profile from P24 (solid red line). The shaded regions represent the 1σ and 3σ confidence intervals. The solid blue line and light blue band instead show the median l.o.s. velocity dispersion and the 3σ band obtained by fitting the same dataset as P24, except for the central LOSVDs. The black squares with error bars depict the l.o.s. velocity dispersion from P24 computed with Mateo et al. (2008) data, and the smaller black squares in the inner region show the dispersion of the LOSVDs fitted by P24 (see their Figure 2). For comparison, l.o.s. velocity dispersion data from H20 along the major axis of Leo I are shown as yellow triangles with error bars. The vertical light blue bands mark the regions within the maximum influence radius (rinfl ≤ 20 pc) of the BH in Leo I, and within 150 pc. Bottom panel: symmetrized stellar anisotropy parameter profile derived from the posterior distribution from P24, including 1σ and 3σ confidence intervals. As in the top panel, the red curve and band correspond to the models from P24, and the blue curve and band show the models obtained by fitting the same dataset as P24, except for the LOSVDs. |
| In the text | |
|
Fig. 3 rperi – ρ150 anticorrelation for the eight classical dSphs from Cardona-Barrero et al. (2023). The central ρ150 densities are taken from Kaplinghat et al. (2019), and the pericentric distances are taken from Battaglia et al. (2022). The orange band represents the fit to the gray and black points as derived by Cardona-Barrero et al. (2023). The blue point corresponds to the measurement for Leo I, with ρ150 derived in this work. |
| In the text | |
|
Fig. 4 Left panel: DM decay D factor profiles computed from the posterior distribution presented from P24 (solid black line) together with the 1σ and 3σ bands. Right panel: same as the left panel, but showing the J-factor profile. The small insets in the bottom panels show the model D and J factors at an aperture of 0.5° compared to values from the literature: Hayashi et al. (2016, H16) in yellow, H20 in blue and Geringer-Sameth et al. (2015, GS15)in purple. |
| In the text | |
Current usage metrics show cumulative count of Article Views (full-text article views including HTML views, PDF and ePub downloads, according to the available data) and Abstracts Views on Vision4Press platform.
Data correspond to usage on the plateform after 2015. The current usage metrics is available 48-96 hours after online publication and is updated daily on week days.
Initial download of the metrics may take a while.