Fig.
Download original image
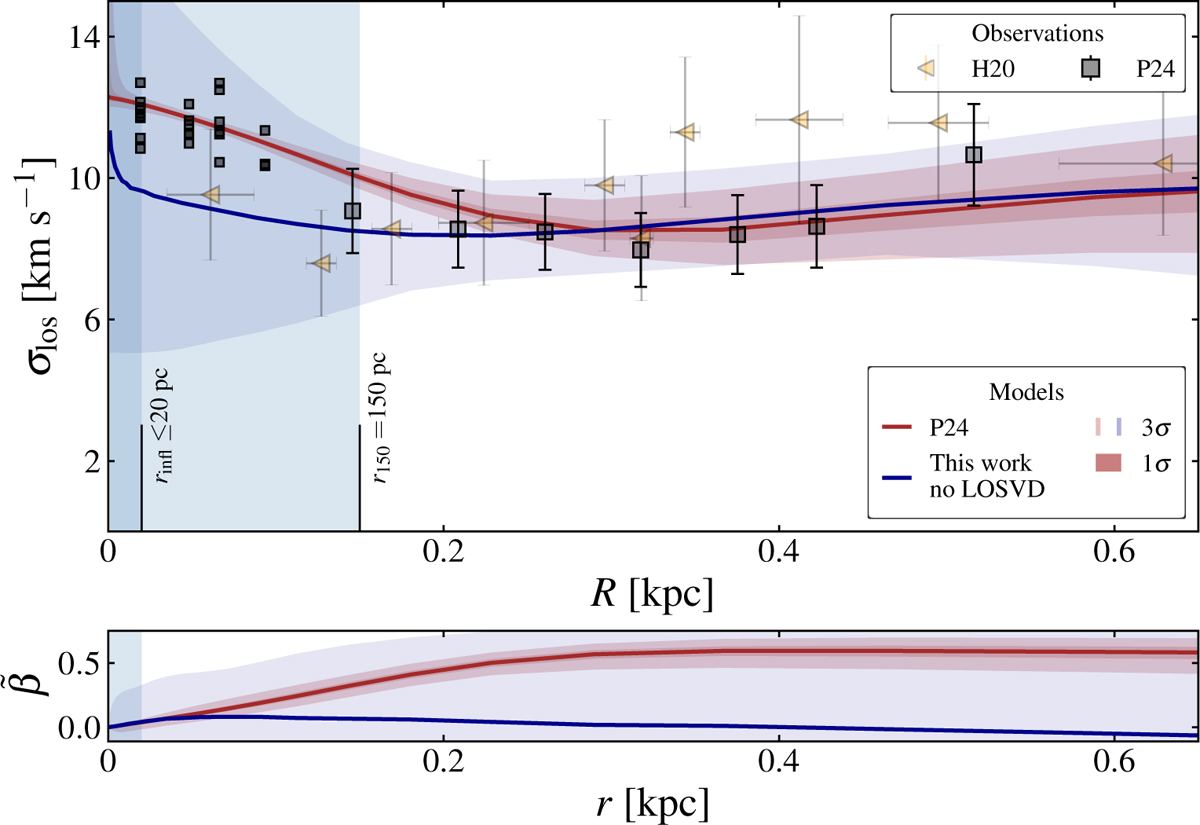
Kinematic properties of Leo I. Top panel: median l.o.s. stellar velocity dispersion profile from P24 (solid red line). The shaded regions represent the 1σ and 3σ confidence intervals. The solid blue line and light blue band instead show the median l.o.s. velocity dispersion and the 3σ band obtained by fitting the same dataset as P24, except for the central LOSVDs. The black squares with error bars depict the l.o.s. velocity dispersion from P24 computed with Mateo et al. (2008) data, and the smaller black squares in the inner region show the dispersion of the LOSVDs fitted by P24 (see their Figure 2). For comparison, l.o.s. velocity dispersion data from H20 along the major axis of Leo I are shown as yellow triangles with error bars. The vertical light blue bands mark the regions within the maximum influence radius (rinfl ≤ 20 pc) of the BH in Leo I, and within 150 pc. Bottom panel: symmetrized stellar anisotropy parameter profile derived from the posterior distribution from P24, including 1σ and 3σ confidence intervals. As in the top panel, the red curve and band correspond to the models from P24, and the blue curve and band show the models obtained by fitting the same dataset as P24, except for the LOSVDs.
Current usage metrics show cumulative count of Article Views (full-text article views including HTML views, PDF and ePub downloads, according to the available data) and Abstracts Views on Vision4Press platform.
Data correspond to usage on the plateform after 2015. The current usage metrics is available 48-96 hours after online publication and is updated daily on week days.
Initial download of the metrics may take a while.