Fig. 4
Download original image
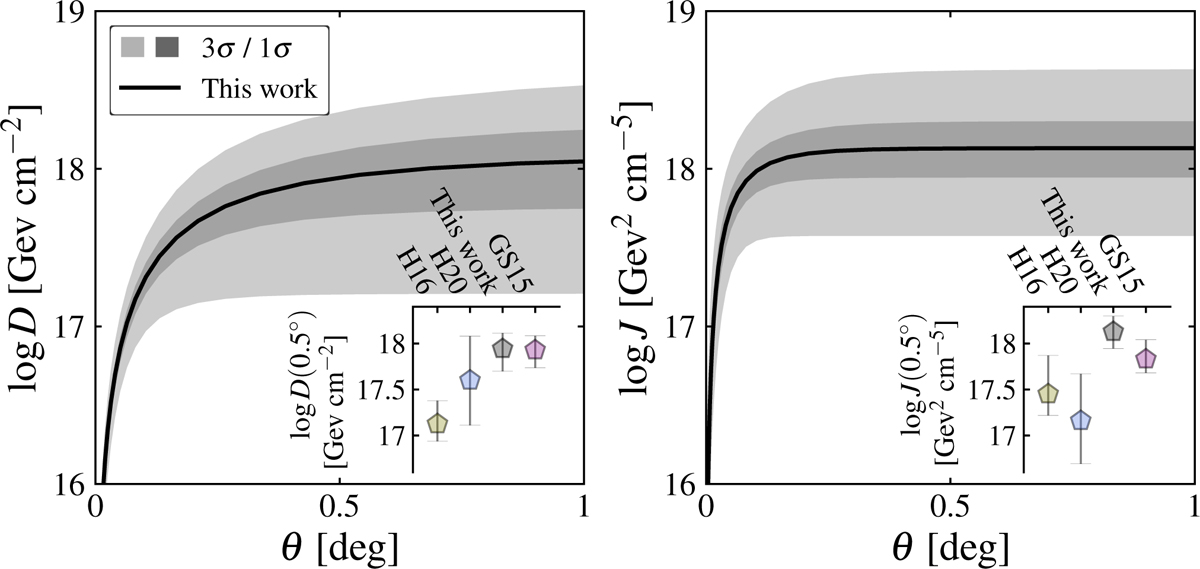
Left panel: DM decay D factor profiles computed from the posterior distribution presented from P24 (solid black line) together with the 1σ and 3σ bands. Right panel: same as the left panel, but showing the J-factor profile. The small insets in the bottom panels show the model D and J factors at an aperture of 0.5° compared to values from the literature: Hayashi et al. (2016, H16) in yellow, H20 in blue and Geringer-Sameth et al. (2015, GS15)in purple.
Current usage metrics show cumulative count of Article Views (full-text article views including HTML views, PDF and ePub downloads, according to the available data) and Abstracts Views on Vision4Press platform.
Data correspond to usage on the plateform after 2015. The current usage metrics is available 48-96 hours after online publication and is updated daily on week days.
Initial download of the metrics may take a while.