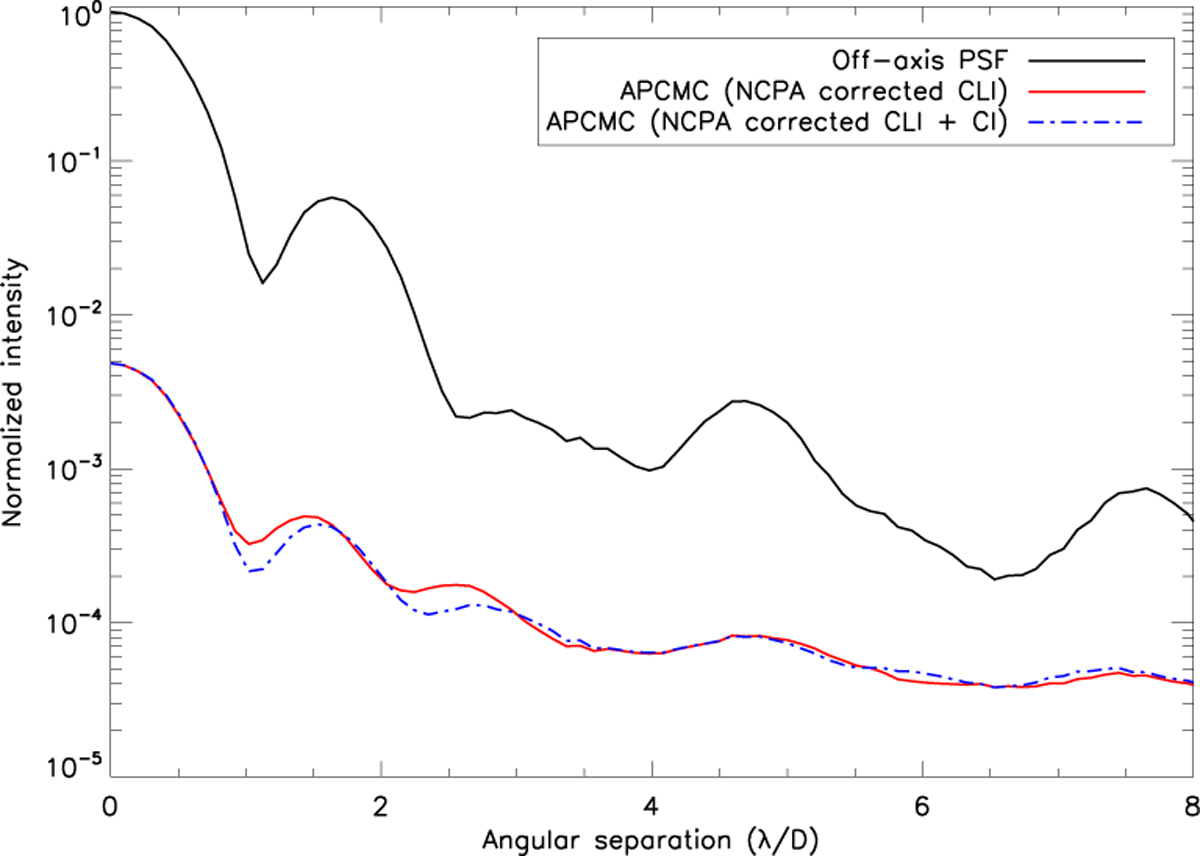
Fig. 15
Download original image
Experimental results of dOTF. Azimuthally averaged radial profiles of the off-axis PSF (black curve) with two APCMC profiles: one when NCPAs are corrected using an offset map applied to the ASM, estimated in classical imaging mode (CLI, red curve), and another when the offset map applied to the ASM combines the one estimated in CLI with an additional correction estimated in coronagraphic imaging mode (CI, blue curve).
Current usage metrics show cumulative count of Article Views (full-text article views including HTML views, PDF and ePub downloads, according to the available data) and Abstracts Views on Vision4Press platform.
Data correspond to usage on the plateform after 2015. The current usage metrics is available 48-96 hours after online publication and is updated daily on week days.
Initial download of the metrics may take a while.