Fig. 6
Download original image
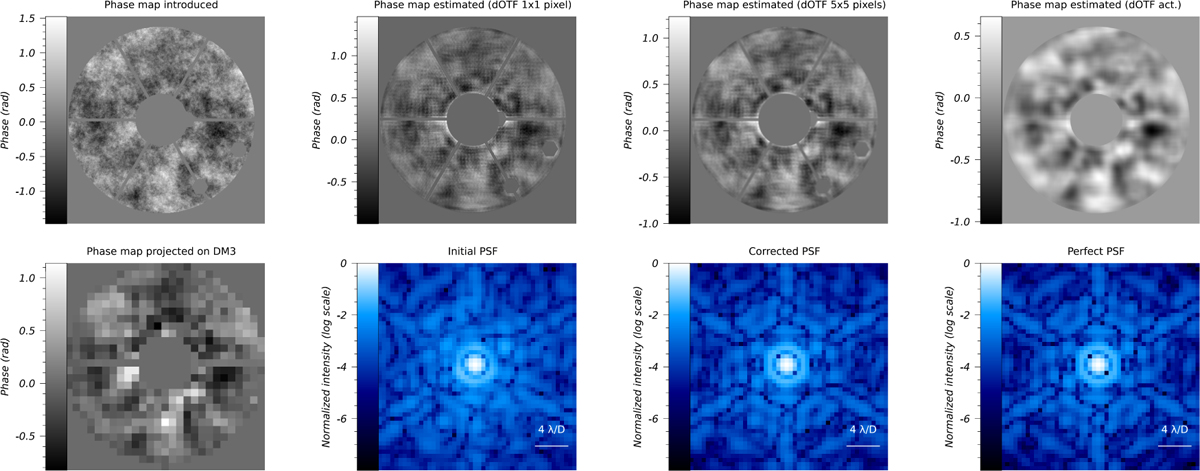
Results of dOTF for NCPAs correction. The top row of panels shows the input phase map (top left), followed by phase maps estimated using different coronagraphic dOTF poke implementations from left to right. The second row sequentially presents the phase map projected onto DM3, the initial PSF, the corrected PSF, and the theoretically ideal PSF for reference.
Current usage metrics show cumulative count of Article Views (full-text article views including HTML views, PDF and ePub downloads, according to the available data) and Abstracts Views on Vision4Press platform.
Data correspond to usage on the plateform after 2015. The current usage metrics is available 48-96 hours after online publication and is updated daily on week days.
Initial download of the metrics may take a while.