Fig. C.1.
Download original image
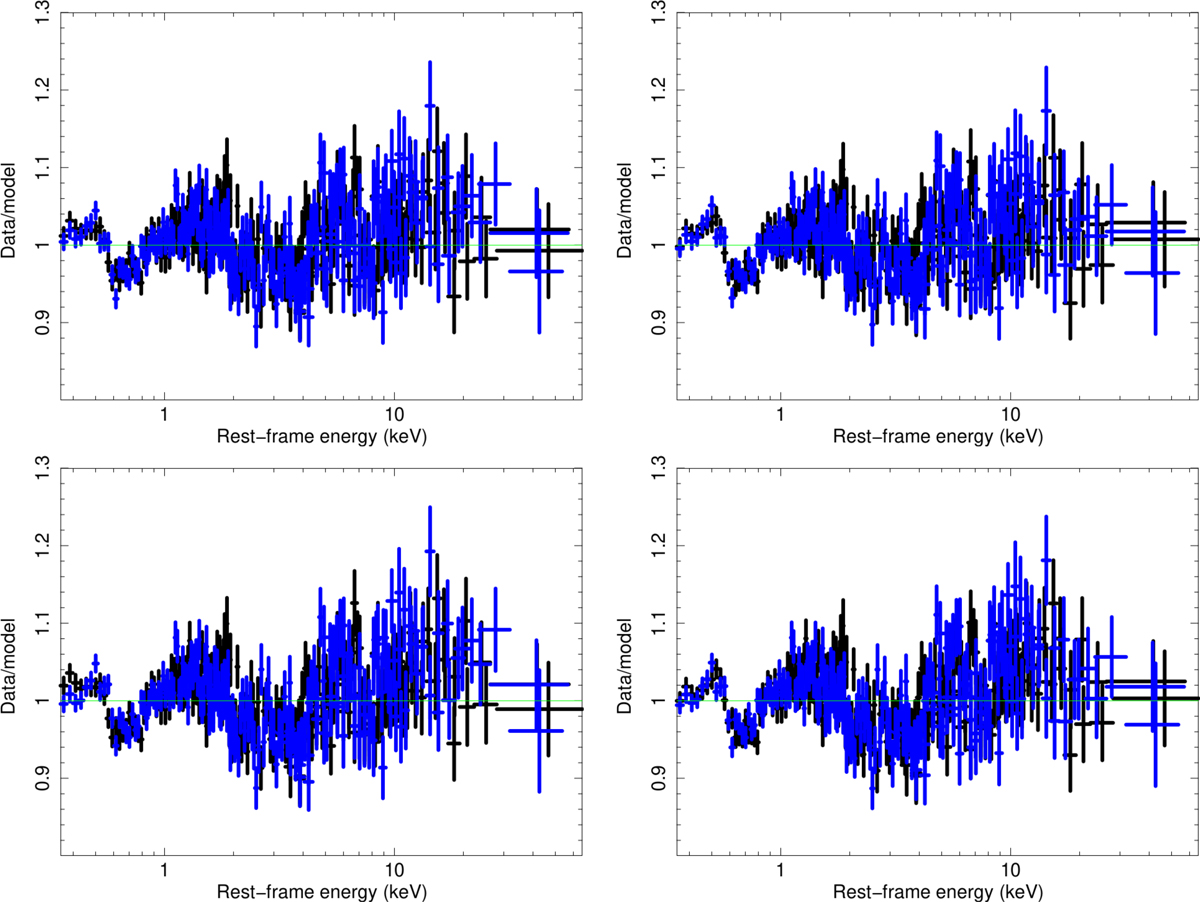
Data-to-model ratio of the fits using the REXCOR model grids for the May 2018 (black) and November 2018 (blue) simultaneous XMM-Newton and NuSTAR spectra. The inferred parameter values are reported in Table C.1. Top left panel: Model calculated for a spin of 0.99 and a hot corona height of 5 Rg (χ2/d.o.f.=1871.5/1437). Top right panel: Model calculated for a spin of 0.99 and a hot corona height of 20 Rg (χ2/d.o.f. = 1864.8/1437). Bottom left panel: Model calculated for a spin of 0.90 and a hot corona height of 5 Rg (χ2/d.o.f. = 1957.1/1437). Bottom right panel: Model calculated for a spin of 0.90 and a hot corona height of 20 Rg (χ2/d.o.f. = 1970.8/1437).
Current usage metrics show cumulative count of Article Views (full-text article views including HTML views, PDF and ePub downloads, according to the available data) and Abstracts Views on Vision4Press platform.
Data correspond to usage on the plateform after 2015. The current usage metrics is available 48-96 hours after online publication and is updated daily on week days.
Initial download of the metrics may take a while.