| Issue |
A&A
Volume 700, August 2025
|
|
|---|---|---|
| Article Number | A81 | |
| Number of page(s) | 16 | |
| Section | Extragalactic astronomy | |
| DOI | https://doi.org/10.1051/0004-6361/202555060 | |
| Published online | 08 August 2025 | |
A possible two-fold scenario for the disc-corona of the luminous active galactic nucleus 1H 0419-577: A high-density disc or a warm corona
1
Aix Marseille Univ, CNRS, CNES, LAM, Marseille, France
2
Department of Physics, Institute for Astrophysics and Computational Sciences, The Catholic University of America, Washington, DC 20064, USA
3
INAF, Osservatorio Astronomico di Brera, Via Bianchi 46, I-23807 Merate, (LC), Italy
⋆ Corresponding author: This email address is being protected from spambots. You need JavaScript enabled to view it.
Received:
7
April
2025
Accepted:
30
June
2025
Abstract
Context. 1H 0419-577 is a highly accreting, luminous broad-line type-I active galactic nucleus (AGN). The process(es) at work in its disc-corona system, especially the origin of the soft X-ray excess, is still highly debated based on XMM-Newton observations: relativistic reflection from the illumination of the accretion disc by the hot corona versus Comptonisation of seed photons from the accretion disc by a warm corona, in addition to the hot one.
Aims. This study aims to characterise the disc-corona system of 1H 0419-477 using, for the first time, simultaneous XMM-Newton and NuSTAR observations, performed in May and November 2018.
Methods. We conducted high-resolution grating spectroscopy to identify potential soft X-ray absorption and emission features. To measure the hot corona temperatures from the spectral analysis above 3 keV, we also included data from a previous NuSTAR observation from June 2015. We characterised the disc-corona system properties by analysing the broadband spectra and the spectral energy distribution (SED) from UV to hard X-rays.
Results. 1H 0419-577 was observed in a bare-like high-flux state at both epochs, with negligible neutral and ionised absorption along its line of sight at both Galactic and AGN rest-frames. However, several soft X-ray emission lines were detected, notably a broad and intense O VII line indicating an accretion disc origin at only a few tens of gravitational radii. The broadband X-ray spectra revealed a prominent, absorption-free smooth soft X-ray excess, a weak Fe Kα complex, and a lack of a Compton hump. Fitting data above 3 keV yielded apparent moderate hot corona temperatures of ∼20–30 keV for the 2018 and 2015 observations, depending on the model applied. The 2018 X-ray broadband spectra were well reproduced by either a relativistic reflection model with a high-density accretion disc (∼1018 cm−2), or a hybrid model combining warm and hot coronae with relativistic reflection. We performed the SED analysis for the latter scenario, which indicated that both the hot and warm coronae would have a small spatial extent.
Conclusions. Both scenarios can successfully reproduce the two 2018 observations of 1H 0419-577, but they imply very different physical conditions, for example, in terms of disc density, temperature and accretion power released in the hot corona and the origin of the UV emission.
Key words: accretion / accretion disks / radiation mechanisms: general / galaxies: active / quasars: general / X-rays: individuals: 1H 0419-577
© The Authors 2025
 Open Access article, published by EDP Sciences, under the terms of the Creative Commons Attribution License (https://creativecommons.org/licenses/by/4.0), which permits unrestricted use, distribution, and reproduction in any medium, provided the original work is properly cited.
This article is published in open access under the Subscribe to Open model. This email address is being protected from spambots. You need JavaScript enabled to view it. to support open access publication.
1. Introduction
1H 0419-577 (z = 0.104) is a very bright radio-quiet broad-line active galactic nucleus (AGN) with a strong big blue bump (Brissenden et al. 1987; Turner et al. 1999; Guainazzi et al. 1998). It has a full width at half maximum (FWHM) for Hβ of 3241 ± 366 km s−1 (Chen et al. 2022). The central supermassive black hole mass has been estimated to be log(MBH/M⊙) = 8.123 from single-epoch spectroscopy of UV emission lines (Tilton & Shull 2013), with an Eddington accretion rate of about 0.1–0.4 (e.g., Pounds et al. 2004a; Di Gesu et al. 2014), depending on its flux state. In X-rays, 1H 0419-577 exhibits significant flux variability and spectral changes, with its soft X-ray flux varying by approximately a factor of ten over several years (Guainazzi et al. 1998; Pounds et al. 2004a; Di Gesu et al. 2014). Using multi-epoch short-length XMM-Newton observations from 2002 and 2003, the variable soft X-ray excess strength has been attributed to variable absorption by low-ionisation matter close to the supermassive black hole (Pounds et al. 2004b). This matter becomes more ionised and less opaque as the flux increases, while its covering factor (∼50–60%) remains almost constant (Di Gesu et al. 2014). Furthermore, the high angular resolution of Chandra has revealed an X-ray outflow that is extended by kiloparsecs (Di Gesu et al. 2017). From its first NuSTAR observation performed in 2015 (∼160 ks), a low-to-moderate hot corona temperature has been inferred, depending on the model applied (kThot = 15 ± 1 keV Turner et al. 2018;
  keV Jiang et al. 2019b). Regarding the prominent soft X-ray excess observed for 1H 0419-577, two alternative physical origins have been proposed: (i) a combination of light-bending from relativistic reflection and a thin warm absorber component (Fabian et al. 2005; Jiang et al. 2019a), and (ii) a warm corona in addition to the standard hot corona (Di Gesu et al. 2014; Petrucci et al. 2018; Palit et al. 2024; Ballantyne et al. 2024). However, these two scenarios have been tested solely on XMM-Newton observations. Therefore, it is insightful to test them using simultaneous high signal-to-noise XMM-Newton and NuSTAR observations, and to infer the physical properties of the disc-corona system of 1H 0419-577.
This work presents a detailed spectral analysis – X-ray broadband and spectral energy distribution (SED) – of the first two simultaneous XMM-Newton and NuSTAR observations of 1H 0419-577, performed approximately six months apart in May and November 2018. The source was observed at both epochs in a high X-ray flux state. In Sect. 2, we detail the data reduction and analysis methods for the dataset. Section 3.1 presents the data analysis of the resolution grating spectrometer (RGS), showing that 1H 0419-577 was observed in a bare-like state at both epochs with no noticeable rest-frame neutral or ionised absorber. The analysis of data above 3 keV, including the long 2015 NuSTAR observation, to probe the hot corona and relativistic reflection contributions, is reported in Sect. 3.2. The full X-ray broadband spectra are then investigated to test two alternative scenarios: the relativistic reflection solely (Sect. 3.3) and the hybrid scenario including the presence of a warm corona in addition to the hot corona and relativistic reflection (Sect. 3.4). For the latter scenario, the SED is also used to constrain the physical parameters of the corresponding disc-corona system. Finally, the main results are summarised and discussed in Sect. 4.
2. Observations, data reduction, and analysis method
2.1. XMM-Newton and NuSTAR data reduction
XMM-Newton (Jansen et al. 2001) and NuSTAR (Harrison et al. 2013) simultaneously observed 1H 0419-577 for the first time in May and November 2018. For the data analysis above 3 keV (see Sect. 3.2), we also use the deep archival NuSTAR observation performed in June 2015. Table 1 summarises the main information about the datasets used in this work.
Observation log of the XMM-Newton and NuSTAR datasets for 1H 0419-577 analysed in this work.
2.1.1. XMM-Newton data reduction
The XMM-Newton data were reprocessed using the Science Analysis System (SAS, version 21.0.0) with the most recent calibration as of September 3, 2024. Due to the high luminosity of 1H 0419-577, the European Photon Imaging Camera (EPIC) instruments, pn (Strüder et al. 2001) and MOS (Turner et al. 2001), were used in small window and partial window modes, respectively. This study focused solely on pn data, selecting event patterns 0–4 (single and double events) due to its superior sensitivity above about 6 keV. A circular region with a 35″ radius, centred on 1H 0419-577, was used to extract pn spectra, avoiding the chip’s edge. Background spectra were obtained from a rectangular area in the small window’s lower section, containing minimal or no photons from 1H 0419-577. Table 1 presents the total net exposure times, adjusted for deadtime (29% for small window mode) and background flaring. The SAS tasks rmfgen and arfgen were employed to generate all redistribution matrix files (RMF) and ancillary response files (ARF). They were binned to oversample the instrumental resolution by at least a factor of four, with no impact on the fit results. For the arf calculation, we applied the recent option applyabsfluxcorr=yes, which allows for a correction of the order of 6–8% between 3 and 12 keV to reduce differences in the spectral shape between XMM-Newton-pn and NuSTAR spectra (F. Fürst 2022, XMM-CCF-REL-388, XMM-SOC-CAL-TN-0230)1. Finally, the background-corrected pn spectra were binned to have a signal-to-noise ratio greater than four in each spectral channel.
The 2018 RGS spectra were also reprocessed and analysed. The individual RGS 1 and RGS 2 spectra at each epoch were combined into a single merged spectrum using the SAS task rgscombine. This resulted in a total count rate from the combined RGS (den Herder et al. 2001) spectrum of 0.273 ± 0.002 cts s−1 over an exposure time of 51 ks for May 2018 and 0.312 ± 0.002 cts s−1 over an exposure time of 52 ks for November 2018. The spectra were binned to sample the RGS spectral resolution by adopting a constant wavelength binning of Δλ = 0.05 Å per spectral bin over the wavelength range from 6 to 36 Å. This ensured a minimum signal-to-noise ratio per bin of ten over the RGS energy range, allowing for χ2 minimisation in the spectral fitting procedure.
The 2018 UV data from the XMM-Newton Optical-UV Monitor (hereafter OM; Mason et al. 2001) at each epoch were processed using the SAS script omichain. This script handles all necessary calibration processes (e.g., flat fielding) and runs a source detection algorithm before performing aperture photometry (using an extraction radius of 5.7″) on each detected source. Then it combines the source lists from separate exposures into a single master list to compute the mean corrected count rates. We quadratically added a representative systematic error of 1.5%2 to the statistical error of the count rate to account for the OM calibration uncertainty in the conversion factor between the count rate and the flux, following the method used in Porquet et al. (2019); Porquet et al. (2024a,b).
2.1.2. NuSTAR data reduction
The level 1 NuSTAR data products were processed using the NuSTAR Data Analysis Software (NuSTARDAS) package (version v2.1.4; released on August 22, 2024) for both focal plane modules A (FPMA) and B (FPMB). Cleaned event files (level 2 data products) were generated and calibrated using standard filtering criteria with the nupipeline task, along with the calibration files from the NuSTAR calibration database (CALDB: 20240826). For the three NuSTAR observations and each module, source and background spectra were extracted with a radius of 60″. The corresponding net exposure times are reported in Table 1. The default RMF and ARF files provided by the pipeline are on a linear energy grid with 40 eV steps. Since the full width at half maximum (FWHM) energy resolution of NuSTAR is 400 eV below ∼50 keV and increases to 1 keV at 86 keV, we rebinned the RMF and ARF files both in energy and channel space by a factor of four. This rebinning oversamples the instrumental energy resolution by at least a factor of 2.5. The background-corrected NuSTAR spectra were then binned to ensure a signal-to-noise ratio greater than four in each spectral channel. To account for cross-calibration uncertainties between the NuSTAR spectra (FPMA and FPMB) and the XMM-Newton pn spectra, we included a free cross-normalisation factor (approximately 1.2 for these datasets) in the fit to adjust for any differences between the NuSTAR and pn spectra.
2.2. Spectral analysis method
Spectral analysis was performed using the XSPEC software package (version 12.14.1; Arnaud et al. 1996). The Galactic column density,  , was fixed at 1.21 × 1020 cm−2, which includes contributions from both H I (1.16 × 1020 cm−2; HI4PI Collaboration 2016) and H II (5.11 × 1018 cm−2; Willingale et al. 2013). We applied the X-ray absorption model TBABS (version 2.3.2; Wilms et al. 2000) using interstellar medium (ISM) elemental abundances from Wilms et al. (2000) and cross-sections from Verner et al. (1996). A χ2 minimisation was used throughout the analysis, with errors quoted at 90% confidence intervals for one interesting parameter (i.e. Δχ2 = 2.71). For cosmological parameters, we adopted the following default values: H0 = 67.66 km s−1 Mpc−1, Ωm = 0.3111, and ΩΛ = 0.6889 (Planck Collaboration VI 2020).
For all fits, we consistently verified the robustness of the final parameter values and ensured that the solution is not trapped in a local (false) minimum of the χ2 space. To do so, we: (i) initiated the fits using different sets of starting values for the parameters, and (ii) used the steppar command to explore the χ2 value across the full allowed range of each parameter. This approach has proven especially valuable for parameters expressed on a logarithmic scale, such as the ionisation parameter or the disc density for the RELXILL and REFLKERRD models.
3. Spectral analysis
To characterise the main X-ray components of the spectra, we simultaneously fit the XMM-Newton-pn and NuSTAR data over the energy ranges 3–5 keV and 7–10 keV (AGN rest-frame) using a power-law model with Galactic absorption. We obtained hard photon indices of Γ = 1.73 ± 0.02 and Γ = 1.71 ± 0.02 for the May and November 2018 observations, respectively. As shown in Fig. 1, extrapolating the fit over the full energy range reveals a pronounced, smooth soft X-ray excess below 2 keV. This excess appears to be absorption-free, with only a minor discrepancy below approximately 0.5 keV between the two epochs. Only a weak but resolved Fe Kα complex is observed (Fig. 2). The flat hard X-ray spectrum, combined with a noticeable deficit above ∼30 keV, is generally attributed to a low hot corona temperature and/or a weak (or even absent) relativistic reflection component (but see Sect. 3.3).
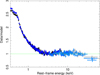 |
Fig. 1. Data-to-model ratio of the two 2018 simultaneous XMM-Newton-pn and NuSTAR spectra of 1H 0419-577 fit with a power-law model corrected for Galactic absorption over the 3–5 and 7–10 keV (AGN rest-frame) energy ranges and then extrapolated over the 0.3–79 keV energy range. May 2018: XMM-Newton/pn (black) and NuSTAR (light grey). November 2018: XMM-Newton/pn (blue) and NuSTAR (light blue). |
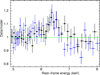 |
Fig. 2. Zoom-in on the Fe Kα line with pn data only (black: May 2018, and blue: November 2018). |
3.1. The RGS data analysis
Although the two 2018 X-ray broadband CCD spectra (Fig. 1) suggest that 1H 0419-577 exhibits a similar smooth soft X-ray spectrum, our goal is to investigate any potential soft X-ray features using the high-resolution RGS spectrum. We fitted the combined 2018 RGS spectrum to characterise the underlying continuum, corrected for Galactic neutral absorption. For this, we used a combination of Comptonisation (COMPTT; Titarchuk 1994) and a power-law component (with Γ fixed at 1.7) to model the curvature of the soft X-ray spectrum. This corresponds to the baseline model: TBABS(GAL)×(COMPTT + POWERLAW). The fit was found to be unsatisfactory (χ2/d.o.f. = 392.9/283,  ) due to the presence of several H-like and/or He-like ion emission lines around the rest-frame energies of N VII Lyα, O VII, O VIII, Ne IX, and Mg XI (see Fig. 3). All of these emission lines are broad, except for O VII, which shows both a narrow and a broad component.
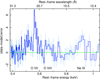 |
Fig. 3. Residuals from a continuum (comptt plus powerlaw) model corrected for Galactic absorption applied to the combined 2018 RGSspectrum. |
Therefore, we added six Gaussian line components to the baseline model to account for these emission features. The width of the O VII narrow line was left free, while the widths of the broad lines were linked to that of the prominent O VII broad line in proportion to their energy, i.e. a constant velocity width, rather than being a constant energy width. We found that, when all broad line widths were allowed to vary independently, the resulting values were consistent with that of the broad O VII line, although they were only coarsely constrained. The inclusion of these lines significantly improved the fit statistics (χ2/d.o.f. = 262.9/273,  ). Specifically, adding the broad line at 576 ± 4 eV (∼21.53 Å) resulted in a reduction in the χ2 value of −77.5, with three degrees of freedom (Table 2). The width of the broad O VII line was determined to be 17
 eV, corresponding to a FWHM of about 20 700
 km s−1. This value is much larger than that found for the broad-line region (BLR; FWHM(Hβ)∼3200 km s−1), which would indicate an accretion disc origin. In contrast, the O VII narrow line (FWHM ≲ 2100 km s−1) likely originates from a much more distant photoionised region, such as the narrow-line region (NLR). Other lines, including N VII Lyα, O VIII Lyα, Ne IX, and Mg XI, also contributed to the improvement in the fit. The parameters of the COMPTT model were determined to be
 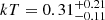 keV and
  .
.
Soft X-ray emission lines in the 1H 0419-577 rest-frame observed in the combined 2018 RGS spectrum.
We then checked for the presence of an ionised absorber at the Galactic (z = 0) or the AGN rest-frame. To do this, we multiplied the above model by an XSTAR (Kallman & Bautista 2001) photoionised absorption table grid, constructed with an ionisation parameter, ξ3, in log scale ranging from −1.5 to 3.5 and a turbulence velocity of 200 km s−1. None is required by the data, with Δχ2 of only −5.6 for two additional parameters and −3.1 for three additional parameters for a Galactic or an AGN rest-frame ionised absorber, respectively. There is no noticeable impact on the soft X-ray emission line characteristics (energies, widths, EWs). For a warm absorber (WA) in the rest-frame AGN, we obtained  × 1020 cm−2, log ξWA = 1.8 ± 0.4, and vout∼0.01 c. This shows that any WA is negligible and points to a bare-like state of 1H 0419-577 during these two observations.
Since the intense O VII emission broad line appears to be compatible with an accretion disc origin, we replaced its Gaussian line component with a relativistic line model, KYRLINE (Dovčiak et al. 2004), while maintaining a Gaussian shape for the other broad but weaker emission lines for simplicity. We note that there is no longer a requirement for a broad N VII component in this model; in fact, the excess flux at this wavelength is now fitted by the red wing of the O VII relativistic line. The single emissivity index was fixed to three, while the accretion disc inclination, and its inner (Rin) and outer (Rout) radii were left free to vary. A good fit was found with χ2/d.o.f = 269.4/272 (Fig. 4). We inferred a disc inclination angle of 28.7 degrees and values for Rin and Rout of 10 ± 2 Rg and 50
 Rg, respectively. We then modelled all the broad emission lines with a XSTAR photoionised plasma emission model. To account for the broadening due to the apparent disc origin of the soft X-ray emission lines, we convolved the XSTAR grid with the KDBLUR model. Only the narrow O VII component line, which is likely formed at the NLR scale, is still modelled with a Gaussian line. We fixed Rout to 50 Rg as found previously from the KYRLINE model, since it is otherwise not constrained here. We found a good fit (χ2/d.o.f = 287.3/279) and inferred Rin = 7 ± 1 Rg, θ = 30 ± 1 degrees,
  > 4 × 1022 cm−2, and log ξemis = 1.8 ± 1. For a 1–1000 Ryd ionising luminosity of about 5.8 × 1045 erg s−1 (inferred from the SED fit of the May 2018 observation; Sect. 3.4.2), for a radius of 10 Rg, this corresponds to a density of about 2.4 × 1015 cm−3. This value is compatible with an accretion disc origin.
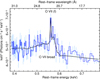 |
Fig. 4. Fit of the broad O VII emission line with a relativistic line model applied to the combined 2018 RGS spectrum. |
3.2. Spectral analysis above 3 keV at three epochs: June 2015, May 2018, and November 2018
We aim to determine the hot corona properties and the disc reflection contribution of 1H 0419-577 during the two 2018 simultaneous XMM-Newton and NuSTAR observations. For this analysis, we considered only data above 3 keV to avoid any influence from the soft X-ray excess emission. Additionally, we included the long 2015 NuSTAR observation of 1H 0419-577 to investigate any potential variability of the hot corona temperature on timescales of a few years.
As a first step, we fit the data of these three epochs with a phenomenological model combining a power-law (Γ) continuum with an exponential cut-off at high energy (Ecut). We added two Fe Kα Gaussian emission lines with a rest-frame energy fixed at 6.4 keV: one broad (width free to vary) and one unresolved narrow (width fixed at 0 eV) to account for any emission contribution from the accretion disc and more distant regions (BLR, NLR, and/or torus), respectively. We noticed that when the energy of the broad line was left free to vary, it was not well constrained. The normalisation of the narrow line was tied across the three epochs, as was the width (in eV) of the broad line. A satisfactory fit was obtained (Fig. 5 top panel, Table 3). The equivalent widths (EWs) of the broad line were similar across the three epochs and significantly lower than the typical EWs of the broad Fe Kα lines seen in unobscured AGN (EW∼100–150 eV; Guainazzi et al. 2006; de La Calle Pérez et al. 2010; Patrick et al. 2012). The width of the broad line corresponds to a FWHM of 25 400 km s−1, which is much broader – despite the large error bars – than that of the Hβ line originating from the BLR (FWHM(Hβ)∼3 200 km s−1), but consistent with an origin from the inner accretion disc, as found for the O VII line (∼20 700 km s−1; Sect. 3.1). The very small EW of < 12 eV of the narrow line suggests an insignificant contribution from any reflection in the BLR, NLR, and/or the molecular torus, as reported from previous XMM-Newton observations (e.g. Jiang et al. 2019b).
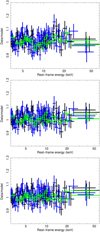 |
Fig. 5. Fits above 3 keV of the two 2018 simultaneous XMM-Newton/pn and NuSTAR spectra and of the 2015 NuSTAR spectra. The corresponding fit parameters are reported in Table 3. Black: May 2018 XMM-Newton/pn and NuSTAR data. Blue: November 2018 XMM-Newton/pn and NuSTAR data. Green: June 2015 NuSTAR data. Top panel: ZCUTOFFPL model. Middle panel: RELXILLCP model. Bottom panel: REFLKERRD model. |
Simultaneous fits above 3 keV of the May and November 2018 XMM-Newton/NuSTAR and of the June 2015 NuSTAR observation of 1H 0419-577.
Then, we applied more physical models combining the primary Comptonisation continuum shape (hot corona) and the relativistic reflection contribution. Such a Compton continuum is more physical and exhibits a sharper high-energy roll-off compared to an exponential cut-off power-law. Furthermore, these models have the advantage of directly measuring the hot corona temperature (kThot). We considered two models: RELXILLCP4 (version 2.3; Dauser et al. 2010; García et al. 2016) and REFLKERRD5 (Niedźwiecki et al. 2019). For the incident Comptonisation spectrum, RELXILLCP uses the NTHCOMP model (Zdziarski et al. 1996; Życki et al. 1999), while REFLKERRD uses the COMPPS model (Poutanen & Svensson 1996). We accounted for the weak Fe Kα core as previously done, by including a narrow (σ = 0 eV) Gaussian line at 6.4 keV. The single power-law disc emissivity index (q; with emissivity ∝R−q) was set at the standard value of three. The inner radius of the accretion disc was set to the inner stable circular orbit (ISCO). The disc density value was fixed at the default value (1015 cm−3), and the iron abundance was set to unity in both models. The reflection fraction ℛ is defined as the amount of reflection Ω/(2π). The disc inclination angle was set at 30° (consistent with the RGS spectral analysis of the broad O VII line), while the black hole spin was fixed at 0.998. Both models provided good fits with kThot∼17–18 keV for RELXILLCP and kThot∼23–28 keV for REFLKERRD, respectively (Table 3, Fig. 5). The values are compatible within their error bars between the two models. In addition, for each model, similar values (within their error bars) for the hot corona temperature were measured for the three epochs.
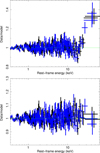 |
Fig. 6. Data-to-model ratio of the two simultaneous May (black) and November (blue) 2018 XMM-Newton/pn and NuSTAR spectra over the 0.3–79 keV energy range, fit with the RELFLKERRD model. Top panel: The disc density (in log scale) is set to the default value of 15. The corresponding parameter fits are reported in the second column of Table 4. Bottom panel: Both the disc density and the accretion disc inclination were free to vary. The corresponding parameter fits are reported in the third column of Table 6. |
3.3. Investigation of the relativistic model over the X-ray broadband range
We now examine the relativistic reflection model over the X-ray broadband spectra using REFLKERRD for the two simultaneous 2018 XMM-Newton and NuSTAR observations. The disc density was initially set to its default value of 1015 cm−3. The black hole spin and iron abundance were allowed to vary but were tied between both epochs since they are not expected to change on monthly timescales. We allowed for a broken emissivity index for the disc at both epochs: q1 is the emissivity index for r < Rbr, and q2 is the emissivity index for r > Rbr, where Rbr is the breaking radius expressed in Rg. A non-satisfactory fit was found over the X-ray broadband range due to a prominent positive excess above about 30 keV as a result of the steep continuum required to model the soft X-ray excess (Fig. 6, top panel). The corresponding parameter values are reported in Table 4 (second column). A similar result was obtained when the RELXILLCP model was used instead (see Appendix A).
However, reflection from discs with densities higher than 1015 cm−3 can contribute towards the soft X-ray excess, as shown by García et al. (2016). Such high-density disc models have been successfully applied to several XMM-Newton observations of low-mass AGNs with MBH ∼ 105–106 M⊙ (Mallick et al. 2018, 2022), and also to simultaneous or quasi-simultaneous XMM-Newton and NuSTAR observations of several AGNs with much higher black hole masses of ∼107–109 M⊙ (e.g. Xu et al. 2021; Madathil-Pottayil et al. 2024; Mallick et al. 2025). Therefore, we allowed the density of the disc to vary. For the REFLKERRD model, the disc density values span a range (in log scale) from 15 to 19. The two 2018 X-ray broadband spectra were well reproduced with a disc density value of log (ne/cm−3) = 18.1 ± 0.1 (Fig. 6, bottom panel). The best-fit parameters are reported in Table 4 (third column). We note that, when using the RELXILLCP model (version 2.3) instead, where the allowed density range on a log scale is 15–20, a good fit was also found, but with a slightly higher inferred disc density of log (ne/cm−3) = 19.5 (see Appendix A). Such a high-density disc allows for a lower reflection fraction compared to the default case (1015 cm−3), due to the enhancement of the emissivity of the free-free continuum. This leads to a consequent increase in the reflection continuum (García et al. 2016; Ding et al. 2024). Furthermore, the disc ionisation parameter was significantly higher, with log ξ∼3, compared to the model with the standard disc density value. Asdiscussed in Ding et al. (2024), even in a highly ionised state, high-density discs can produce strong oxygen (∼0.6–0.8 keV) resonance features, as observed in the RGS spectrum (Sect. 3.1). We note that these results are not affected, even if the weak narrow Fe Kα line is accounted by a more physical model, such as BORUS12 (Baloković et al. 2018), or if a very thin warm absorber component is included, as found by the RGS data analysis (Sect. 3.1). Remarkably, the hot corona temperature was found to be on the order of ∼400 keV, much higher than the value inferred when fitting the data above 3 keV only (kTe∼25 keV; Sect. 3.2). We note that if we impose the hot corona temperatures to match the values obtained from the fit above 3 keV (Sect. 3.2), a satisfactory fit cannot be achieved due to a large excess above ∼40 keV (χ2/d.o.f. = 1677.9/1440). For comparison, the same modelling was performed using RELXILLCP, as reported in Appendix A. As for the REFLKERRD model, much higher hot corona temperatures were found, exceeding 200–300 keV. However, the reflection fraction and spin values were higher than those found with REFLKERRD, while the inclination angle was much lower. This suggests that the shape of the Comptonised continuum may have a substantial impact on these parameters, at least for the present dataset. Nevertheless, despite these discrepancies, both relativistic models with a high-density disc can accurately reproduce the two 2018 X-ray broadband spectra of 1H 0419-577.
3.4. Investigation of hybrid model including a warm corona over the X-ray broadband and SED
We now consider an alternative scenario in which the soft X-ray excess arises primarily from Compton up-scattering of thermal (optical/UV) photons by a population of mildly hot (kTe∼0.1–1 keV), optically thick (τ∼10–30) electrons in a warm corona, rather than by relativistic reflection. However, detailed analysis of the soft X-ray band – particularly the broad O VII feature – and the emission above 3 keV reveals clear evidence for a significant contribution from relativistic reflection in 1H 0419-577. This necessitates a hybrid interpretation, involving emission from a warm corona, a hot corona, and relativistic reflection. Notably, in this hybrid scenario, relativistic reflection can also contribute partially to the observed soft X-ray excess.
3.4.1. The X-ray broadband analysis
As a first step, we tested whether the soft X-ray excess could originate from a warm corona, using a simple modelling approach with the COMPTT model, assuming a slab geometry. The REFLKERRD model was used to account for emission from both the hot corona and the relativistic reflection (Sect. 3.2). For the relativistic reflection component, we assumed a single emissivity index (q), which was left free to vary, while the inner radius of the accretion disc was set to ISCO. The disc density was fixed at its standard value of 1015 cm−3. This simple modelling provides an overall good fit to the X-ray spectra (Fig. B.1), suggesting that an optically thick warm corona, with kTwarm∼0.3 keV and τwarm∼13, could indeed account for the prominent soft X-ray excess in 1H 0419-577, without requiring a high-density disc as in the pure relativistic reflection scenario (see Sect. 3.3). However, the emissivity indices for both epochs are steeper than the standard value of three, indicating that significant relativistic reflection is still needed even in this warm corona scenario. This is further supported by the reflection fraction values, which are around 0.6. The best-fit parameters are reported in Table B.1. Unlike the high-density disc scenario in the relativistic model, the inferred hot corona temperatures are comparable with those derived from the fits above 3 keV (Sect. 3.2).
We then decided to explore this hybrid scenario further using a more physically model. For this, we considered REXCOR which incorporates the effects of ionised relativistic reflection and a warm corona over the 0.3–100 keV energy range (Ballantyne 2020; Ballantyne & Xiang 2020; Xiang et al. 2022). The accretion energy released in the inner disc is distributed among the three presumed components of the disc-corona system (Fig. 1 in Xiang et al. 2022): the hot corona (assumed to follow a lamppost geometry above the black hole spin axis), the warm corona, and the outer accretion disc. REXCOR accounts for relativistic light-bending and blurring effects up to 400 Rg, using the RELCONV_LP convolution model (Dauser et al. 2013). Additionally, it incorporates a radially varying disc density for each annulus. Notably, when this model was applied to two XMM-Newton observations of 1H 0419-577 from 2010, Ballantyne et al. (2024) found that the soft X-ray excess was primarily driven by emission from a warm corona rather than by relativistic reflection. Therefore, our goal is to quantitatively assess the contribution of a possible warm corona, compared to a pure relativistic reflection scenario, in shaping the soft X-ray excess of 1H 0419-577 during the two 2018 observations. The REXCOR fits and results are detailed in Appendix C. The inferred warm corona heating fraction values (∼40–70%, depending on the grid model) would suggest that the soft X-ray excess at both epochs is primarily dominated by warm corona emission. Intriguingly, this stands in contrast to the high-density disc scenario presented earlier, which provides an excellent fit to the X-ray broadband spectra without requiring any contribution from a warm corona component.
3.4.2. The SED analysis
We now investigate the SED, assuming a hybrid scenario, from UV to hard X-rays for the two 2018 observations, adopting a physically motivated approach to characterise the disc-corona system of 1H 0419-577. For this, we used the new RELAGN model, which builds upon the AGNSED code of Kubota & Done (2018) but incorporates general relativistic ray tracing (Hagen & Done 2023a). The model describes a three-zone disc-corona system: an inner hot corona (RISCO ≤ R ≤ Rhot), a warm Comptonised disc (Rhot ≤ R ≤ Rwarm), and an outer standard accretion disc (Rwarm ≤ R ≤ Rout). A schematic of this geometry is illustrated in Fig. 2 of Kubota & Done (2018). The parameters of RELAGN are similar to those of AGNSED, with one key addition: a free parameter that accounts for a colour temperature correction to the standard outer disc (fcol). In contrast, AGNSED assumes a fixed value of unity for this correction. A detailed description of the RELAGN model is provided in Hagen & Done (2023a), with applications to several AGNs, including Fairall 9, Mrk 110, and ESO 141-G55 (Hagen & Done 2023a; Mitchell et al. 2023; Porquet et al. 2024a,b). We note that when relativistic effects are not included, as for AGNSED, the accretion rate and the black hole spin may be significantly underestimated compared to RELAGN (Hagen & Done 2023a; Porquet et al. 2024a)
We used only the three shortest-wavelength UV filters from the OM instrument (UVW2, UVM2, UVW1; effective wavelengths: 2120, 2310, and 2910 Å, respectively), as host galaxy contamination is negligible in these bands. However, we accounted for the contribution from the BLR, which produces the small blue bump emission around ∼3000 Å (Grandi 1982; Mehdipour et al. 2015), overlapping with the UVW1 filter. To model this contribution, we employed an additive table called SMALLBB, where the normalisation is the only free parameter (see Petrucci et al. 2018; Matzeu et al. 2020, and references therein). This parameter was tied between both 2018 observations. The Galactic reddening value for 1H 0419-577 is E(B − V) = 0.011 (Schlafly & Finkbeiner 2011). For the colour correction of the outer disc, we applied the relation from Done et al. (2012) by setting the fcol parameter to a negative value. The height of the hot corona (hmax in Rg) was tied to its radius (Rhot). We adopted a distance of 449.4 Mpc (Wright 2006; Planck Collaboration VI 2020) and a black hole mass of 1.33 × 10⁸ M⊙. The inclination of the accretion disc was left as a free parameter.
Since relativistic reflection is definitively present – but not included in the RELAGN model – we incorporated the REFLKERRD model. The emissivity indices were both fixed at the canonical value of three. The inner radius of the relativistic reflection component was set to match Rhot, as the system is truncated below this radius. The reflection fraction was fixed at −1 to account solely for the relativistic reflection component from REFLKERRD. Additionally, we included the weak narrow core of the Fe Kα line using a narrow Gaussian component. Our final model is TBABS×REDDEN(SMALLBB+RELAGN+REFLKERRD+ZGAUSSIAN). This model provided an excellent fit from the UV to hard X-rays (Fig. 7, top panel), with the corresponding physical parameter values reported in Table 5. The Eddington accretion rate ratio for 1H 0419-577 is notably high, around ∼0.5–0.6. The warm corona temperature, kTwarm∼0.4 keV, is consistent with the value obtained using the simplified COMPTT model. The moderate disc inclination angle of ∼22° aligns well with the value derived from the RGS data analysis of the O VII broad line profile. The obtained value for Rhot (∼6–7 Rg), which defines the inner radius of the disc-corona system, closely matches the inner radius of the region where relativistic reflection occurs, as inferred from the O VII line profile (∼10 Rg; Sect. 3.1). The warm corona appears to be rather compact, extending only about 1.3–1.9 times the size of the hot corona. From this best-fit model, we determined a lower limit of 0.996 for the black hole spin, based on the classical Δχ2 = 2.706 criterion. As shown in Fig. 7 (bottom panel), the warm corona emission, which in this scenario is the primary origin of the soft X-ray excess, can also significantly contribute to the UV Big Blue Bump.
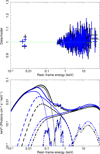 |
Fig. 7. SED fit from UV to hard X-rays of 1H 0419-577 using the RELAGN+REFLKERRD model for the May (black) and November (blue) 2018 simultaneous XMM-Newton and NuSTAR. The values of the best-fit parameters are reported in Table 5. Top panel: Data-to-model ratio. Bottom panel: Intrinsic SED corrected for reddening and Galactic absorption (solid curves), with the main individual emission components: Outer disc (dotted curves), warm optically thick Comptonisation (dashed curves; warm corona), hot optically thin Comptonisation (dash-dotted curves; hot corona), and relativistic reflection (three-dotted-dashed curves). For clarity, the weak narrow Gaussian linecomponent is not displayed. |
4. Summary and discussion
We presented the first X-ray spectral analysis of two simultaneous XMM-Newton and NuSTAR observations of 1H 0419-577, conducted in May and November 2018. The source was observed at a similarly high X-ray flux during both epochs. The broadband X-ray spectra are characterised by a prominent, absorption-free, and smooth soft X-ray excess, a weak Fe Kα emission line, and the absence of a Compton hump.
From the analysis of the combined RGS spectrum of the two 2018 observations, 1H 0419-577 can be classified as a bare-like AGN during these epochs, with an upper limit of ∼2 × 1020 cm−2 for the column density of any WA. However, several soft X-ray emission lines in the RGS spectrum were present, associated with the AGN and arising from He- and/or H-like ions of N, O, Ne, and Mg. Similar soft X-ray emission lines have been reported in other bright bare AGNs, such as Ark 120 (Reeves et al. 2016), Fairall 9 (Emmanoulopoulos et al. 2011; Lohfink et al. 2016), and ESO 141-G55 (Porquet et al. 2024b). In these cases, the lines were attributed to emission from the BLR and/or NLR, reinforcing the idea that bare AGNs are not intrinsically devoid of gas, but rather that substantial X-ray-emitting material exists outside the direct line of sight. This interpretation applies to the narrow component of the O VII emission line detected in 1H 0419-577, which is most likely associated with a distant region such as the NLR. However, the other detected emission lines appear to be velocity broadened. The most intense broad line, O VII, has a full width at half maximum (FWHM) of ∼20 700 km s1, consistent with an origin in the inner accretion disc (∼10–50 Rg) at an inclination angle of approximately 30°, as inferred from fitting a relativistic line profile (Sect. 3.1). For comparison, the Hβ line emitted by the BLR has a significantly lower FWHM of ∼3200 km s−1. Using the definition of ξ ≡ Lion/(neR2), we inferred a density of ∼2.4 × 1015 cm−3, which is consistent with an origin in the accretion disc. A similarly broad O VII line, originating from the inner disc, was unambiguously detected for the first time in Mrk 110 (Reeves et al. 2021b). This finding suggests that for bare AGNs with low enough Galactic column density and viewed at a moderate or nearly face-on inclination, the O VII line, which is often the most prominent soft X-ray emission line, can serve as a valuable probe of relativistic reflection which may occur in the inner accretion disc, similar to the commonly used broad Fe Kα line.
A moderately broad Fe Kα line is observed, with a small EW (∼40–50 eV), which remains consistent across all three epochs. Its EW is notably lower than the typical values (∼100–150 eV) observed in unobscured AGNs (see, e.g. Guainazzi et al. 2006; de La Calle Pérez et al. 2010; Patrick et al. 2012). Its average width,  km s−1, is consistent with an origin in the inner accretion disc, in agreement with the broad soft X-ray O VII emission line. The very small EW of the narrow Fe Kα core (≤12 eV) indicate an insignificant reflection contribution from the BLR and/or the molecular torus, consistent with previous XMM-Newton observations (e.g. Jiang et al. 2019b). This EW of the narrow Fe Kα component in 1H 0419-557 is significantly smaller than the typical values found for type I AGNs (∼50–100 eV; Liu & Wang 2010; Shu et al. 2010; Fukazawa et al. 2011; Ricci et al. 2014). This can be attributed to a decrease in the covering factor of the molecular torus with increasing X-ray luminosity, leading to an anti-correlation between the EW of the narrow core Fe Kα line and the X-ray continuum luminosity. This relation is known as the ‘X-ray Baldwin’ effect, or the ‘Iwasawa-Taniguchi’ effect (e.g. Iwasawa & Taniguchi 1993; Page et al. 2004; Bianchi et al. 2007; Shu et al. 2010; Ricci et al. 2014). According to the relationship between the EW of the Fe Kα narrow core and the 2–10 keV AGN luminosity, as established by Bianchi et al. (2007), an EW of ∼30 eV is expected for 1H 0419-577 given its 2–10 keV luminosity of about 4 × 1044 erg s−1.
Two models were applied above 3 keV to probe the hot corona and relativistic reflection properties, allowing for a direct measurement of the hot corona temperature (RELXILLCP and REFLKERRD; Dauser et al. 2010; García et al. 2016; Niedźwiecki et al. 2019). Our analysis also incorporated the deep NuSTAR dataset obtained in 2015. The hot corona temperatures are compatible within their error bars between both models, and across the three epochs (Table 1): ∼17–18 keV and kThot ∼23–28 keV for RELXILLCP and REFLKERRD, respectively. These measurements are in good agreement with previous reports for 1H 0419-577 using NuSTAR and/or Neil Gehrels Swift observations (Turner et al. 2018; Jiang et al. 2019b; Akylas & Georgantopoulos 2021; Kamraj et al. 2022; Kang & Wang 2022; Pal et al. 2024; Serafinelli et al. 2024). We note that the measurement of the mean value of the hot corona is model-dependent as shown in Sect. 3.2, and is often inferred in the literature from the cut-off energy value. Therefore, any robust comparison should be made under the same modelling assumption. The lack of variability of the hot corona temperature across the three epochs may be simply due to 1H 0419-577 being observed in a similar hard X-ray flux state. Therefore, any possible ‘hotter-when-brighter’ or ‘cooler-when-brighter’ behaviour cannot be tested, as has been done for some AGNs (Keek & Ballantyne 2016; Ursini et al. 2016; Zhang et al. 2018; Middei et al. 2019; Kang et al. 2021; Pal & Stalin 2023). The hot corona temperatures for 1H 0419-577 are located in the lower range of the distribution found from AGN samples (e.g. < kThot > = 50 ± 21 keV Middei et al. 2019). Such low to moderate hot corona temperatures have been observed in several luminous highly accreting AGNs (e.g. GRS 1734-292, Tortosa et al. 2017; Ark 564, Kara et al. 2017; PDS 456, Reeves et al. 2021a; and IRAS 04416+1215, Tortosa et al. 2022), but also in luminous AGNs accreting at much lower rates (e.g., ESO 362-G18, Xu et al. 2021; ESO 511-G030, Zhang et al. 2023; Mrk 110, Porquet et al. 2024a, and HE 1029-1401, Vaia et al. 2024). Several physical processes have been proposed to explain such mild temperatures of the hot corona, such as pair production (with possible non-thermal particle contribution), strong cooling of the electrons due dense UV photon fields, and/or scattering due to the relatively high optical depth of their hot corona (e.g., Fabian et al. 2015, 2017; Kara et al. 2017; Ricci et al. 2018).
Regarding the two 2018 X-ray broadband spectra, we found that relativistic reflection alone onto an accretion disc with a standard density fixed at 1015 cm−3 can be definitively ruled out, whatever the model used (REFLKERRD or RELXILLCP; Sect. 3.3 and Appendix A). However, letting the density of the disc vary freely, the two broadband spectra, from the soft X-ray excess to the hard X-ray shape, can be nicely reproduced for a much higher disc density of log (ne/cm−3) ∼ 18.1 or of log (ne/cm−3)∼19.5 for REFLKERRD and RELXILLCP, respectively. Such a high-density disc value was also found in some other AGNs using simultaneous XMM-Newton and NuSTAR data and applying the RELXILL model, such as ESO 362-G18 (log (ne/cm−3) = 18.3; Xu et al. 2021) and RBS 1124 (log (ne/cm−3) = 19.2; Madathil-Pottayil et al. 2024). Recently, Mallick et al. (2025) inferred from a sample of eleven AGNs, with black hole mass spanning (in log scale) ∼5.5–9.0, that for about 70% of the AGNs a high-disc density model can fit their X-ray broadband spectra. For the remaining AGNs of their sample, an additional warm Comptonisation component is necessary to account for the observed soft X-ray excess.
We note that the values of the disc density for 1H 0419-577 inferred from the two models are greater than the one found from the analysis of the broad O VII emission line, ∼2.4 × 1015 cm−3, using ξ ≡ Lion/(neR2). However, this definition of ξ is a good approximation when photoionisation and recombination processes dominate the thermal equilibrium and ionisation balance. This becomes invalid for high-density plasmas where other mechanisms, such as free–free heating and cooling, become important (García et al. 2016). This may explain the discrepancy between the methods to infer the disc density. In both cases, a high black hole spin is favoured with a = 0.90 ± 0.01 and a = 0.988 ± 0.004 for REFLKERRD and RELXILLCP, respectively. Interestingly, the inferred hot corona temperatures are greater than a few hundred keV, which are much higher than those found using only the data above 3 keV (Sect. 3.2). Therefore, at least for the present case, it would mean that relativistic reflection onto a high-density disc could mimic a lack of Compton hump in the NuSTAR energy range, which could be otherwise interpreted as a low temperature for the hot corona.
Considering a standard α accretion disc in the case where the inner region is radiation dominated, the predicted density as a function of radius is given by (Svensson & Zdziarski 1994)
![Mathematical equation: $$ n_{\rm e} \approx 7\times 10^{12} \dot{m}^{-2} r^{3/2} \left[1-\left(\frac{3}{r}\right)\right]^{-1} (1-f)^{-3}\,\mathrm{cm}^{-3}, $$](/articles/aa/full_html/2025/08/aa55060-25/aa55060-25-eq82.gif)
where r is in Schwarzschild units, ṁ is the dimensionless accretion rate, defined as  , and f is the fraction of power radiated in the corona. The Figure 1 of García et al. (2016) displays, in the black hole mass-f plane, the lines corresponding to different ne ṁ2 values, assuming a radius of 20 Rg and α = 0.1. For 1H 0419-577, this corresponds to f ∼ 93% or f ∼ 98% for the REFLKERRD and RELXILLCP modellings, respectively. This means that in the high-density disc scenario, almost all the power would be radiated in the hot corona (X-rays) for 1H 0419-577 during these two observations. Such values are compatible with f values found for RBS 1124 (f ≥ 90% Madathil-Pottayil et al. 2024), and from sample studied in Mallick et al. (2025) where the median value is 0.7
 . This seems to be in contradiction to the significant optical-UV emission observed from 1H 0419-577 (Brissenden et al. 1987; Guainazzi et al. 1998; Turner et al. 1999), and to the 0.3–79 keV X-ray luminosity accounting for only ∼20% of the bolometric luminosity. Some additional processes can enhance optical-UV emission, in addition to the standard thermal emission of the accretion disc. These processes include X-ray reprocessing by the accretion disc, the BLR and/or a disc wind (e.g. Troyer et al. 2016; Lobban et al. 2018; McHardy et al. 2018; Edelson et al. 2019; Matthews et al. 2020; Vincentelli et al. 2022; Panagiotou et al. 2022; Hagen & Done 2023b; Lewin et al. 2024). However, they could only partially account for the strong UV-to-X-ray flux ratio observed in 1H 0419-577, which therefore remains challenging to explain in the present case.
We also considered an alternative scenario that includes the presence of a warm corona, in addition to the hot corona and relativistic reflection. In this case, the soft X-ray excess would primarily originate from this warm corona region, with a partial contribution from relativistic reflection. This hybrid model has been shown to well reproduce the X-ray broadband spectra and SEDs of several other bare AGNs (Ark 120, Porquet et al. 2018; Fairall 9, Lohfink et al. 2016; Partington et al. 2024; Ton S180, Matzeu et al. 2020, Mrk 110 Porquet et al. 2021, 2024a, and ESO 141-G55, Porquet et al. 2024b). Chen et al. (2025) show that it can adequately reproduce the soft X-ray excess strength and shape for a sample of 59 type I AGNs observed with XMM-Newton. This scenario, in which the warm corona is proposed as the primary origin of the soft X-ray excess, may explain observed cases where the soft X-ray excess closely tracks the variability of the UV/optical disc emission, while the hard X-ray power-law component shows weaker or uncorrelated variability (e.g., Mrk 509, Mehdipour et al. 2011; ESO 511-G030, Middei et al. 2023; Mrk 841, Mehdipour et al. 2023; Fairall 9, Partington et al. 2024; Mrk 590, Palit et al. 2025). Indeed, the warm corona contributes to both the soft X-ray excess and the UV emission. However, this behaviour poses challenges to scenarios in which the soft excess arises solely from relativistic reflection.
In general, the warm corona model requires specific physical conditions to explain the soft X-ray excess observed in AGNs. Reaching an optical depth above five demands strong magnetic support, with magnetic-to-gas pressure ratios exceeding thirty (Różańska et al. 2015). A key ingredient is ‘anomalous internal heating’, in which a substantial fraction of the accretion power is dissipated within the corona, a process that remains poorly understood and is usually treated as a free parameter (Petrucci et al. 2018, 2020). Several processes have been proposed to explain the origin of such internal heating, often attributed broadly to the dissipation of accretion energy, with specific mechanisms including magnetic heating such as the magneto-rotational instability dynamo process and reconnection, viscous accretion within the corona, and the dissipation of waves (Różańska et al. 2015; Gronkiewicz et al. 2023; Ma et al. 2025). Simulations show that, only with sufficient mechanical heating, warm coronae produce smooth, line-free spectra consistent with the observed soft excess (Petrucci et al. 2018, 2020; Ballantyne 2020; Ballantyne & Xiang 2020). If these specific heating or density conditions are not fulfilled, the models predict absorption features not seen in observations (García et al. 2019; Kara & García 2025). In this context, hard X-ray illumination, which is believed to originate from the hot corona, also plays a vital role in maintaining the gas in a enough high-ionisation state to reduce photoelectric opacity (Ballantyne 2020; Ballantyne & Xiang 2020; Petrucci et al. 2020; Xiang et al. 2022). Recent efforts incorporating realistic geometries and magnetic effects further support the existence of warm, optically thick coronae (Gronkiewicz et al. 2023; Kawanaka & Mineshige 2024).
We applied to the X-ray broadband the REXCOR model, which combines the effects of both the emission for ionised relativistic reflection and a warm corona (Ballantyne 2020; Ballantyne & Xiang 2020; Xiang et al. 2022). The inferred warm corona heating fraction values are ∼40–70%, while the hot-corona heating fractions are very low at about 2–7%. This would point to a soft X-ray excess dominated by the emission from a warm corona rather than relativistic reflection. The values are consistent with those found for the two 2010 XMM-Newton observations, where 1H 419-577 was observed at a lower X-ray flux (Ballantyne et al. 2024).
Although the REXCOR model accounts for the radial variation in disc density across each annulus, the results it yields differ notably from those obtained with the relativistic reflection model assuming a high-density disc. Indeed, the latter model can reproduce the observed broadband X-ray spectra, including the soft X-ray excess, without invoking a warm corona. Moreover, the two models predict significantly different levels of accretion power released in the hot corona, highlighting the contrasting physical assumptions underlying each model.
For our analysis of the UV to hard X-ray SED of 1H 0419-577 assuming a hybrid model, we applied the RELAGN model that incorporates general relativistic-ray tracing to represent a structured disc-corona system (Hagen & Done 2023a). The model divides the accretion flow into an inner hot corona, a warm Comptonised disc, and an outer standard disc. We also included relativistic reflection using REFLKERRD assuming a standard disc density of 1015 cm−3. This hybrid model nicely reproduces the SED without requiring a disc density different from the standard value, relaxing the need for a very high fraction of the power released on the hot corona, as found for the relativistic reflection-only scenario. A high Eddington accretion rate (around 0.5–0.6), a disc inclination of approximately 22°, and a black hole spin greater than about 0.996 were inferred. The hot corona temperatures (∼40 keV), although slightly higher, are comparable to those found from the fits above 3 keV (Sect. 3.2), in contrast to the high-density disc scenario. The hot corona is found to be relatively compact with Rhot ∼ 6–7 Rg. We note that in this modelling the disc is truncated below Rhot. This value is similar with that obtained from the analysis of the broad O VII emission line, where we found that the inner radius of the relativistic emission starts at about 10 Rg (Sect. 3.1). The warm corona has a temperature of 0.4 keV at both epochs and an optical depth of about 13–14, which are consistent with those measured in AGNs (kTwarm∼0.1–1 keV, τwarm∼10–30, e.g. Porquet et al. 2004; Bianchi et al. 2009; Petrucci et al. 2018; Palit et al. 2024). A small extension of the warm corona about only 1.3–1.9 times larger than the hot corona is found, but still contributes significantly to the UV emission, in addition to the thermal emission for the outer accretion disc.
In summary, both scenarios, relativistic reflection onto a very high-density disc versus a hybrid model combining warm and hot coronae with relativistic reflection, can successfully reproduce the two 2018 1H 0419-577 datasets. However, they imply very different physical conditions, for instance, in terms of disc density, temperature, accretion power released in the hot corona, and the origin of the UV emission. These discrepancies highlight how distinct physical assumptions can lead to divergent interpretations of the same dataset. Therefore, a comparative approach that incorporates multiple modelling frameworks is essential for more robustly constraining the physical conditions in AGN environments and minimising the risk of model-dependent bias. Yet distinguishing between a high-density accretion disc producing pronounced relativistic reflection and a hybrid model (combining warm and hot coronae and relativistic reflection) remains challenging with the existing data. Further work is then required to disentangle these scenarios, potentially through multi-wavelength timing-analysis, multi-epochs X-ray broadband spectra and SEDs obtained at different flux states, higher spectral resolution data and/or time-resolved spectroscopy. In conclusion, the origin of the soft X-ray excess remains an open question not only for 1H 0419-577, but also for many AGNs. It is likely to be diverse and may depend on factors such as the accretion state, black hole mass, and system geometry.
ξ is defined as ≡Lion/(neR2), where Lion is the 1–1000 Rydberg ionising luminosity expressed in erg s−1, ne is the electronic density expressed in cm−3, and R is the plasma distance expressed in cm. ξ is expressed in units of erg cm s−1.
The usage notes as well as the full description of the model and its associated parameters are available at https://www.wfis.uni.lodz.pl/reflkerr/
Acknowledgments
The authors thank the anonymous referee. The paper is based on observations obtained with the XMM-Newton, an ESA science mission with instruments and contributions directly funded by ESA member states and the USA (NASA). This work made use of data from the NuSTAR mission, a project led by the California Institute of Technology, managed by the Jet Propulsion Laboratory, and funded by NASA. This research has made use of the NuSTAR Data Analysis Software (NuSTARDAS) jointly developed by the ASI Science Data Center and the California Institute of Technology. This research has made use of the SIMBAD database, operated at CDS, Strasbourg, France. This research has made use of the NASA/IPAC Extragalactic Database (NED) which is operated by the California Institute of Technology, under contract with the National Aeronautics and Space Administration. This work was supported by the French space agency (CNES). This research has made use of the computing facilities operated by CeSAM data centre at LAM, Marseille, France.
References
- Akylas, A., & Georgantopoulos, I. 2021, A&A, 655, A60 [NASA ADS] [CrossRef] [EDP Sciences] [Google Scholar]
- Arnaud, K. A. 1996, in 101: Astronomical Data Analysis Software and Systems V, eds. G. H. Jacoby, & J. Barnes, ASP Conf. Ser., 17 [Google Scholar]
- Ballantyne, D. R. 2020, MNRAS, 491, 3553 [NASA ADS] [CrossRef] [Google Scholar]
- Ballantyne, D. R., & Xiang, X. 2020, MNRAS, 496, 4255 [NASA ADS] [CrossRef] [Google Scholar]
- Ballantyne, D. R., Sudhakar, V., Fairfax, D., et al. 2024, MNRAS, 530, 1603 [NASA ADS] [CrossRef] [Google Scholar]
- Baloković, M., Brightman, M., Harrison, F. A., et al. 2018, ApJ, 854, 42 [Google Scholar]
- Bianchi, S., Guainazzi, M., Matt, G., & Fonseca Bonilla, N. 2007, A&A, 467, L19 [NASA ADS] [CrossRef] [EDP Sciences] [Google Scholar]
- Bianchi, S., Guainazzi, M., Matt, G., Fonseca Bonilla, N., & Ponti, G. 2009, A&A, 495, 421 [NASA ADS] [CrossRef] [EDP Sciences] [Google Scholar]
- Brissenden, R. J. V., Tuohy, I. R., Remillard, R. A., et al. 1987, PASA, 7, 212 [Google Scholar]
- Chen, Y.-Q., Liu, Y.-S., & Bian, W.-H. 2022, ApJ, 940, 50 [Google Scholar]
- Chen, S.-J., Wang, J.-X., Kang, J.-L., et al. 2025, ApJ, 980, 23 [Google Scholar]
- Dauser, T., Wilms, J., Reynolds, C. S., & Brenneman, L. W. 2010, MNRAS, 409, 1534 [Google Scholar]
- Dauser, T., Garcia, J., Wilms, J., et al. 2013, MNRAS, 430, 1694 [Google Scholar]
- de La Calle Pérez, I., Longinotti, A. L., Guainazzi, M., et al. 2010, A&A, 524, A50 [CrossRef] [EDP Sciences] [Google Scholar]
- den Herder, J. W., Brinkman, A. C., Kahn, S. M., et al. 2001, A&A, 365, L7 [NASA ADS] [CrossRef] [EDP Sciences] [Google Scholar]
- Di Gesu, L., Costantini, E., Piconcelli, E., et al. 2014, A&A, 563, A95 [NASA ADS] [CrossRef] [EDP Sciences] [Google Scholar]
- Di Gesu, L., Costantini, E., Piconcelli, E., et al. 2017, A&A, 608, A115 [NASA ADS] [CrossRef] [EDP Sciences] [Google Scholar]
- Ding, Y., Garcıa, J. A., Kallman, T. R., et al. 2024, ApJ, 974, 280 [Google Scholar]
- Done, C., Davis, S. W., Jin, C., Blaes, O., & Ward, M. 2012, MNRAS, 420, 1848 [Google Scholar]
- Dovčiak, M., Karas, V., & Yaqoob, T. 2004, ApJS, 153, 205 [Google Scholar]
- Edelson, R., Gelbord, J., Cackett, E., et al. 2019, ApJ, 870, 123 [NASA ADS] [CrossRef] [Google Scholar]
- Emmanoulopoulos, D., Papadakis, I. E., McHardy, I. M., et al. 2011, MNRAS, 415, 1895 [NASA ADS] [CrossRef] [Google Scholar]
- Fabian, A. C., Miniutti, G., Iwasawa, K., & Ross, R. R. 2005, MNRAS, 361, 795 [CrossRef] [Google Scholar]
- Fabian, A. C., Lohfink, A., Kara, E., et al. 2015, MNRAS, 451, 4375 [Google Scholar]
- Fabian, A. C., Lohfink, A., Belmont, R., Malzac, J., & Coppi, P. 2017, MNRAS, 467, 2566 [Google Scholar]
- Fukazawa, Y., Hiragi, K., Mizuno, M., et al. 2011, ApJ, 727, 19 [NASA ADS] [CrossRef] [Google Scholar]
- García, J. A., Fabian, A. C., Kallman, T. R., et al. 2016, MNRAS, 462, 751 [Google Scholar]
- García, J. A., Kara, E., Walton, D., et al. 2019, ApJ, 871, 88 [CrossRef] [Google Scholar]
- Gianolli, V. E., Kim, D. E., Bianchi, S., et al. 2023, MNRAS, 523, 4468 [NASA ADS] [CrossRef] [Google Scholar]
- Gianolli, V. E., Bianchi, S., Kammoun, E., et al. 2024, A&A, 691, A29 [NASA ADS] [CrossRef] [EDP Sciences] [Google Scholar]
- Grandi, S. A. 1982, ApJ, 255, 25 [NASA ADS] [CrossRef] [Google Scholar]
- Gronkiewicz, D., Różańska, A., Petrucci, P.-O., & Belmont, R. 2023, A&A, 675, A198 [NASA ADS] [CrossRef] [EDP Sciences] [Google Scholar]
- Guainazzi, M., Comastri, A., Stirpe, G. M., et al. 1998, A&A, 339, 327 [NASA ADS] [Google Scholar]
- Guainazzi, M., Bianchi, S., & Dovčiak, M. 2006, Astron. Nachr., 327, 1032 [NASA ADS] [CrossRef] [Google Scholar]
- Hagen, S., & Done, C. 2023a, MNRAS, 525, 3455 [NASA ADS] [CrossRef] [Google Scholar]
- Hagen, S., & Done, C. 2023b, MNRAS, 521, 251 [NASA ADS] [CrossRef] [Google Scholar]
- Harrison, F. A., Craig, W. W., Christensen, F. E., et al. 2013, ApJ, 770, 103 [Google Scholar]
- HI4PI Collaboration (Ben Bekhti, N., et al.) 2016, A&A, 594, A116 [NASA ADS] [CrossRef] [EDP Sciences] [Google Scholar]
- Ingram, A., Ewing, M., Marinucci, A., et al. 2023, MNRAS, 525, 5437 [CrossRef] [Google Scholar]
- Iwasawa, K., & Taniguchi, Y. 1993, ApJ, 413, L15 [NASA ADS] [CrossRef] [Google Scholar]
- Jansen, F., Lumb, D., Altieri, B., et al. 2001, A&A, 365, L1 [NASA ADS] [CrossRef] [EDP Sciences] [Google Scholar]
- Jiang, J., Fabian, A. C., Dauser, T., et al. 2019a, MNRAS, 489, 3436 [NASA ADS] [CrossRef] [Google Scholar]
- Jiang, J., Walton, D. J., Fabian, A. C., & Parker, M. L. 2019b, MNRAS, 483, 2958 [NASA ADS] [CrossRef] [Google Scholar]
- Kallman, T., & Bautista, M. 2001, ApJS, 133, 221 [Google Scholar]
- Kamraj, N., Brightman, M., Harrison, F. A., et al. 2022, ApJ, 927, 42 [NASA ADS] [CrossRef] [Google Scholar]
- Kang, J.-L., & Wang, J.-X. 2022, ApJ, 929, 141 [NASA ADS] [CrossRef] [Google Scholar]
- Kang, J.-L., Wang, J.-X., & Kang, W.-Y. 2021, MNRAS, 502, 80 [NASA ADS] [CrossRef] [Google Scholar]
- Kara, E., & García, J. 2025, arXiv e-prints [arXiv:2503.22791] [Google Scholar]
- Kara, E., García, J. A., Lohfink, A., et al. 2017, MNRAS, 468, 3489 [NASA ADS] [CrossRef] [Google Scholar]
- Kawanaka, N., & Mineshige, S. 2024, PASJ, 76, 306 [CrossRef] [Google Scholar]
- Keek, L., & Ballantyne, D. R. 2016, MNRAS, 456, 2722 [CrossRef] [Google Scholar]
- Kubota, A., & Done, C. 2018, MNRAS, 480, 1247 [Google Scholar]
- Lewin, C., Kara, E., Barth, A. J., et al. 2024, ApJ, 974, 271 [NASA ADS] [CrossRef] [Google Scholar]
- Liu, T., & Wang, J.-X. 2010, ApJ, 725, 2381 [NASA ADS] [CrossRef] [Google Scholar]
- Lobban, A. P., Porquet, D., Reeves, J. N., et al. 2018, MNRAS, 474, 3237 [Google Scholar]
- Lohfink, A. M., Reynolds, C. S., Pinto, C., et al. 2016, ApJ, 821, 11 [CrossRef] [Google Scholar]
- Ma, Q.-Q., Gu, W.-M., Cai, Z.-Y., et al. 2025, ApJ, 985, 185 [Google Scholar]
- Madathil-Pottayil, A., Walton, D. J., García, J., et al. 2024, MNRAS, 534, 608 [Google Scholar]
- Mallick, L., Alston, W. N., Parker, M. L., et al. 2018, MNRAS, 479, 615 [NASA ADS] [Google Scholar]
- Mallick, L., Fabian, A. C., García, J. A., et al. 2022, MNRAS, 513, 4361 [NASA ADS] [CrossRef] [Google Scholar]
- Mallick, L., Pinto, C., Tomsick, J., et al. 2025, arXiv e-prints [arXiv:2501.15380] [Google Scholar]
- Marinucci, A., Muleri, F., Dovciak, M., et al. 2022, MNRAS, 516, 5907 [NASA ADS] [CrossRef] [Google Scholar]
- Mason, K. O., Breeveld, A., Much, R., et al. 2001, A&A, 365, L36 [NASA ADS] [CrossRef] [EDP Sciences] [Google Scholar]
- Matthews, J. H., Knigge, C., Higginbottom, N., et al. 2020, MNRAS, 492, 5540 [NASA ADS] [CrossRef] [Google Scholar]
- Matzeu, G. A., Nardini, E., Parker, M. L., et al. 2020, MNRAS, 497, 2352 [CrossRef] [Google Scholar]
- McHardy, I. M., Connolly, S. D., Horne, K., et al. 2018, MNRAS, 480, 2881 [NASA ADS] [CrossRef] [Google Scholar]
- Mehdipour, M., Branduardi-Raymont, G., Kaastra, J. S., et al. 2011, A&A, 534, A39 [NASA ADS] [CrossRef] [EDP Sciences] [Google Scholar]
- Mehdipour, M., Kaastra, J. S., Kriss, G. A., et al. 2015, A&A, 575, A22 [NASA ADS] [CrossRef] [EDP Sciences] [Google Scholar]
- Mehdipour, M., Kriss, G. A., Kaastra, J. S., Costantini, E., & Mao, J. 2023, ApJ, 952, L5 [NASA ADS] [CrossRef] [Google Scholar]
- Middei, R., Bianchi, S., Petrucci, P. O., et al. 2019, MNRAS, 483, 4695 [NASA ADS] [CrossRef] [Google Scholar]
- Middei, R., Petrucci, P. O., Bianchi, S., et al. 2023, A&A, 672, A101 [NASA ADS] [CrossRef] [EDP Sciences] [Google Scholar]
- Mitchell, J. A. J., Done, C., Ward, M. J., et al. 2023, MNRAS, 524, 1796 [NASA ADS] [CrossRef] [Google Scholar]
- Morrison, R., & McCammon, D. 1983, ApJ, 270, 119 [Google Scholar]
- Niedźwiecki, A., Szanecki, M., & Zdziarski, A. A. 2019, MNRAS, 485, 2942 [CrossRef] [Google Scholar]
- Page, K. L., O’Brien, P. T., Reeves, J. N., & Turner, M. J. L. 2004, MNRAS, 347, 316 [NASA ADS] [CrossRef] [Google Scholar]
- Pal, I., & Stalin, C. S. 2023, MNRAS, 518, 2529 [Google Scholar]
- Pal, I., Anju, A., Sreehari, H., et al. 2024, ApJ, 976, 145 [Google Scholar]
- Palit, B., Różańska, A., Petrucci, P. O., et al. 2024, A&A, 690, A308 [NASA ADS] [CrossRef] [EDP Sciences] [Google Scholar]
- Palit, B., Śniegowska, M., Markowitz, A., et al. 2025, MNRAS, 540, L14 [Google Scholar]
- Panagiotou, C., Papadakis, I., Kara, E., Kammoun, E., & Dovčiak, M. 2022, ApJ, 935, 93 [NASA ADS] [CrossRef] [Google Scholar]
- Partington, E. R., Cackett, E. M., Edelson, R., et al. 2024, ApJ, 977, 77 [Google Scholar]
- Patrick, A. R., Reeves, J. N., Porquet, D., et al. 2012, MNRAS, 426, 2522 [NASA ADS] [CrossRef] [Google Scholar]
- Petrucci, P.-O., Ursini, F., De Rosa, A., et al. 2018, A&A, 611, A59 [NASA ADS] [CrossRef] [EDP Sciences] [Google Scholar]
- Petrucci, P. O., Gronkiewicz, D., Rozanska, A., et al. 2020, A&A, 634, A85 [NASA ADS] [CrossRef] [EDP Sciences] [Google Scholar]
- Planck Collaboration VI. 2020, A&A, 641, A6 [NASA ADS] [CrossRef] [EDP Sciences] [Google Scholar]
- Porquet, D., Reeves, J. N., O’Brien, P., & Brinkmann, W. 2004, A&A, 422, 85 [NASA ADS] [CrossRef] [EDP Sciences] [Google Scholar]
- Porquet, D., Dubau, J., & Grosso, N. 2010, Space Sci. Rev., 157, 103 [Google Scholar]
- Porquet, D., Reeves, J. N., Matt, G., et al. 2018, A&A, 609, A42 [NASA ADS] [CrossRef] [EDP Sciences] [Google Scholar]
- Porquet, D., Done, C., Reeves, J. N., et al. 2019, A&A, 623, A11 [NASA ADS] [CrossRef] [EDP Sciences] [Google Scholar]
- Porquet, D., Reeves, J. N., Grosso, N., Braito, V., & Lobban, A. 2021, A&A, 654, A89 [NASA ADS] [CrossRef] [EDP Sciences] [Google Scholar]
- Porquet, D., Hagen, S., Grosso, N., et al. 2024a, A&A, 681, A40 [NASA ADS] [CrossRef] [EDP Sciences] [Google Scholar]
- Porquet, D., Reeves, J. N., Hagen, S., et al. 2024b, A&A, 689, A336 [NASA ADS] [CrossRef] [EDP Sciences] [Google Scholar]
- Pounds, K. A., Reeves, J. N., Page, K. L., & O’Brien, P. T. 2004a, ApJ, 605, 670 [Google Scholar]
- Pounds, K. A., Reeves, J. N., Page, K. L., & O’Brien, P. T. 2004b, ApJ, 616, 696 [Google Scholar]
- Poutanen, J., & Svensson, R. 1996, ApJ, 470, 249 [CrossRef] [Google Scholar]
- Reeves, J. N., Porquet, D., Braito, V., et al. 2016, ApJ, 828, 98 [NASA ADS] [CrossRef] [Google Scholar]
- Reeves, J. N., Braito, V., Porquet, D., et al. 2021a, MNRAS, 500, 1974 [Google Scholar]
- Reeves, J. N., Porquet, D., Braito, V., Grosso, N., & Lobban, A. 2021b, A&A, 649, L3 [NASA ADS] [CrossRef] [EDP Sciences] [Google Scholar]
- Ricci, C., Ueda, Y., Ichikawa, K., et al. 2014, A&A, 567, A142 [NASA ADS] [CrossRef] [EDP Sciences] [Google Scholar]
- Ricci, C., Ho, L. C., Fabian, A. C., et al. 2018, MNRAS, 480, 1819 [NASA ADS] [CrossRef] [Google Scholar]
- Różańska, A., Malzac, J., Belmont, R., Czerny, B., & Petrucci, P.-O. 2015, A&A, 580, A77 [NASA ADS] [CrossRef] [EDP Sciences] [Google Scholar]
- Schlafly, E. F., & Finkbeiner, D. P. 2011, ApJ, 737, 103 [Google Scholar]
- Serafinelli, R., De Rosa, A., Tortosa, A., et al. 2024, A&A, 690, A145 [NASA ADS] [CrossRef] [EDP Sciences] [Google Scholar]
- Shu, X. W., Yaqoob, T., & Wang, J. X. 2010, ApJS, 187, 581 [NASA ADS] [CrossRef] [Google Scholar]
- Strüder, L., Briel, U., Dennerl, K., et al. 2001, A&A, 365, L18 [Google Scholar]
- Svensson, R., & Zdziarski, A. A. 1994, ApJ, 436, 599 [NASA ADS] [CrossRef] [Google Scholar]
- Tagliacozzo, D., Marinucci, A., Ursini, F., et al. 2023, MNRAS, 525, 4735 [CrossRef] [Google Scholar]
- Tilton, E. M., & Shull, J. M. 2013, ApJ, 774, 67 [NASA ADS] [CrossRef] [Google Scholar]
- Titarchuk, L. 1994, ApJ, 434, 570 [NASA ADS] [CrossRef] [Google Scholar]
- Tortosa, A., Marinucci, A., Matt, G., et al. 2017, MNRAS, 466, 4193 [NASA ADS] [Google Scholar]
- Tortosa, A., Ricci, C., Tombesi, F., et al. 2022, MNRAS, 509, 3599 [Google Scholar]
- Troyer, J., Starkey, D., Cackett, E. M., et al. 2016, MNRAS, 456, 4040 [Google Scholar]
- Turner, T. J., George, I. M., Grupe, D., et al. 1999, ApJ, 510, 178 [Google Scholar]
- Turner, M. J. L., Abbey, A., Arnaud, M., et al. 2001, A&A, 365, L27 [CrossRef] [EDP Sciences] [Google Scholar]
- Turner, T. J., Reeves, J. N., Braito, V., & Costa, M. 2018, MNRAS, 476, 1258 [NASA ADS] [CrossRef] [Google Scholar]
- Ursini, F., Petrucci, P.-O., Matt, G., et al. 2016, MNRAS, 463, 382 [NASA ADS] [CrossRef] [Google Scholar]
- Vaia, B., Ursini, F., Matt, G., et al. 2024, A&A, 688, A189 [NASA ADS] [CrossRef] [EDP Sciences] [Google Scholar]
- Verner, D. A., Ferland, G. J., Korista, K. T., & Yakovlev, D. G. 1996, ApJ, 465, 487 [Google Scholar]
- Vincentelli, F. M., McHardy, I., Hernández Santisteban, J. V., et al. 2022, MNRAS, 512, L33 [NASA ADS] [CrossRef] [Google Scholar]
- Willingale, R., Starling, R. L. C., Beardmore, A. P., Tanvir, N. R., & O’Brien, P. T. 2013, MNRAS, 431, 394 [Google Scholar]
- Wilms, J., Allen, A., & McCray, R. 2000, ApJ, 542, 914 [Google Scholar]
- Wright, E. L. 2006, PASP, 118, 1711 [NASA ADS] [CrossRef] [Google Scholar]
- Xiang, X., Ballantyne, D. R., Bianchi, S., et al. 2022, MNRAS, 515, 353 [NASA ADS] [CrossRef] [Google Scholar]
- Xu, Y., García, J. A., Walton, D. J., et al. 2021, ApJ, 913, 13 [NASA ADS] [CrossRef] [Google Scholar]
- Zdziarski, A. A., Johnson, W. N., & Magdziarz, P. 1996, MNRAS, 283, 193 [NASA ADS] [CrossRef] [Google Scholar]
- Zhang, J.-X., Wang, J.-X., & Zhu, F.-F. 2018, ApJ, 863, 71 [CrossRef] [Google Scholar]
- Zhang, Z., Jiang, J., Liu, H., et al. 2023, ApJ, 949, 4 [Google Scholar]
- Życki, P. T., Done, C., & Smith, D. A. 1999, MNRAS, 309, 561 [Google Scholar]
Appendix A: Results of relativistic reflection modelling over the full X-ray broad-band range
In this section, we report for comparison the spectral analysis of the two simultaneous XMM-Newton and NuSTAR observations using the RELXILLCP relativistic reflection model (Table A.1, Fig. A.1), instead of REFLKERRD as used in Sect. 3.3.
Simultaneous fits of the two 2018 XMM-Newton and NuSTAR spectra over the 0.3-79 keV range with the RELXILLCP relativistic reflection model corrected for Galactic absorption.
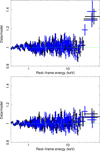 |
Fig. A.1. Data-to-model ratio of the two simultaneous May (black) and November (blue) 2018 XMM-Newton/pn and NuSTAR spectra over the 0.3–79 keV energy range fit with the RELXILLCP model. Top panel: The disc density (in log scale) was set to the default value of 15. The corresponding parameter fits are reported in Table A.1 second column. Bottom panel: The disc density and the accretion disc inclination were free to vary. The corresponding parameter fits are reported in Table A.1 third column. |
Appendix B: Results of the simple hybrid modelling combining the comptt and reflkerrd models
Table B.1 reports the fitted parameter values assuming a simple hybrid model combining the COMPTT and REFLKERRD models, as discussed in Sect. 3.4.1. Fig. B.1 shows the data-to-model ratio of the fit.
Fit of the two 2018 simultaneous 0.3–79 keV XMM-Newton and NuSTAR observations of 1H 0419-577 using COMPTT (warm corona) and REFLKERRD (hot corona and relativistic reflection) models (see Sect. 3.4 for details).
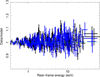 |
Fig. B.1. Data-to-model ratio of the two 2018 0.3-79 keV simultaneous XMM-Newton-pn (black) and NuSTAR (blue) spectrum of 1H 0419-577 fit using a simplistic hybrid model combining the COMPTT (warm corona) and REFLKERRD (hot corona and relativistic reflection) models (see Table B.1 and Sect. 3.4.2 for details). |
Appendix C: ReXcor modelling
The eight publicly available table grids of the REXCOR models were calculated for two black hole spin values (a = 0.90 and a = 0.99), two hot-corona height values (h = 5 Rg and h = 20 Rg), and two Eddington accretion rate values (ṁ = 0.1 and ṁ = 0.01). These grids use a disc inclination angle of 30 degrees and the metal abundances from Morrison & McCammon (1983). The free parameters of the REXCOR grids are: the hot-corona heating fraction with 0.02≤fX≤0.2; the photon index of irradiating power law from the hot corona with 1.7≤Γhot≤2.2; the warm-corona heating fraction with 0.0≤ hf≤0.8: hf = 0 means that the soft X-ray excess is exclusively due to relativistic reflection; and the warm-corona Thomson depth with 10≤τwarm≤30.
The REXCOR grid models do not include the underlying hard X-ray power-law continuum. Therefore, we also added the thermally comptonised continuum model NTHCOMP, allowing us to infer the hot corona temperature (Zdziarski et al. 1996; Życki et al. 1999). We note that if instead a simple cutoff power-law model was applied, the hard X-ray range would not be well reproduced. The weak Fe Kα narrow core is accounted for by including a Gaussian emission line (σ = 0 eV) at 6.4 keV (Sect. 3.2). We applied the grids with the larger Eddington accretion rate, ṁ = 0.1, which is more appropriate for 1H 0419-577 than ṁ = 0.01, though its Eddington accretion rate is higher (∼0.5–0.6; Sect. 3.4.2). The model is TBABS(GAL)×(REXCOR+NTHCOMP+ZGAUSSIAN). The two 2018 XMM-Newton and NuSTAR spectra were fitted simultaneously with hf, Γ, fh, and τT allowed to vary between the two epochs. We note that contrary to Ballantyne et al. (2024) who analysed two previous XMM-Newton observations, we did not include, in the modelling, any warm absorber component since, as inferred from the RGS data analysis no significant warm absorber was observed during these two 2018 observations. Statistically speaking, the best-fit result was found for the model grid calculated for a spin value of 0.99 and a lamppost height of 20 Rg (Table C.1 and Fig. C.1 top right panel). At both epochs, the warm-corona heating fraction values, hf ∼ 40–70%, suggest that a warm corona would primarily produce the softX-ray excess. The inferred warm-corona optical depth, τwarm∼12–15, is consistent with the values obtained using the COMPTT model (τ∼13–14; Sect. 3.4). Based on this modelling, only a small fraction of the accretion energy (fX≤2–3%) would be dissipated in the lamppost hot corona, contrary to the high-disc density scenario. As shown in Fig. C.1, the data-model ratio for all grids shows some noticeable deviations, especially in the soft X-ray range below about 1 keV. The absorption-like feature is due to the residual of the model and not to a genuine absorption feature since none were found in the 2018 RGS data analysis (Sect. 3.1). However, as noted by Xiang et al. (2022), the sensitivity of He-like triplets to temperature, density, and optical depth (Porquet et al. 2010) is not accurately described by the REXCOR model, potentially leading to residuals of a few percent. Furthermore, in this study, we used grids computed for an Eddington accretion rate of 0.1, whereas during the two 2018 observations, the accretion rate of 1H 0419-577 was significantly higher (∼0.5–0.6). This discrepancy may result in an overestimation of the O VII line flux. Furthermore, as highlighted by Ballantyne et al. (2024) and Xiang et al. (2022), several limitations remain that must be taken into account. i) REXCOR assumes a lamppost corona. Yet, for the radio-quiet type 1 AGN observed so far with IXPE, slab-like or wedge-shaped geometries are favoured rather than a spherical lamppost or a conical shape (e.g. NGC 4151, Gianolli et al. 2023, 2024, MCG-05-23-16 Marinucci et al. 2022; Tagliacozzo et al. 2023, IC 4329A Ingram et al. 2023). ii) Currently, the model can only be applied to data above 0.3 keV, whereas the contribution of the accretion disc (optical-UV) to power the hot corona should be included. iii) The available grids are for two Eddington accretion rates (0.01 and 0.1). In this work, we applied the four grids corresponding to the Eddington accretion rate of 0.1. However, this assumption may not be appropriate for 1H 0419-577, which was accreting in these two 2018 observations at a significantly higher rate, ∼0.5–0.6. This provides strong motivation for the extension of the REXCOR grid’s parameter ranges, to adapt it for SED analysis, as well as the possibility of incorporating a slab-like hot corona.
Best-fit results of the two simultaneous 2018 X-ray broadband spectra (XMM-Newton and NuSTAR) using this model: TBABS(REXCOR + NTHCOMP + ZGAUSSIAN).
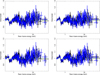 |
Fig. C.1. Data-to-model ratio of the fits using the REXCOR model grids for the May 2018 (black) and November 2018 (blue) simultaneous XMM-Newton and NuSTAR spectra. The inferred parameter values are reported in Table C.1. Top left panel: Model calculated for a spin of 0.99 and a hot corona height of 5 Rg (χ2/d.o.f.=1871.5/1437). Top right panel: Model calculated for a spin of 0.99 and a hot corona height of 20 Rg (χ2/d.o.f. = 1864.8/1437). Bottom left panel: Model calculated for a spin of 0.90 and a hot corona height of 5 Rg (χ2/d.o.f. = 1957.1/1437). Bottom right panel: Model calculated for a spin of 0.90 and a hot corona height of 20 Rg (χ2/d.o.f. = 1970.8/1437). |
All Tables
Observation log of the XMM-Newton and NuSTAR datasets for 1H 0419-577 analysed in this work.
Soft X-ray emission lines in the 1H 0419-577 rest-frame observed in the combined 2018 RGS spectrum.
Simultaneous fits above 3 keV of the May and November 2018 XMM-Newton/NuSTAR and of the June 2015 NuSTAR observation of 1H 0419-577.
Simultaneous fits of the two 2018 XMM-Newton and NuSTAR spectra over the 0.3-79 keV range with the RELXILLCP relativistic reflection model corrected for Galactic absorption.
Fit of the two 2018 simultaneous 0.3–79 keV XMM-Newton and NuSTAR observations of 1H 0419-577 using COMPTT (warm corona) and REFLKERRD (hot corona and relativistic reflection) models (see Sect. 3.4 for details).
Best-fit results of the two simultaneous 2018 X-ray broadband spectra (XMM-Newton and NuSTAR) using this model: TBABS(REXCOR + NTHCOMP + ZGAUSSIAN).
All Figures
|
Fig. 1. Data-to-model ratio of the two 2018 simultaneous XMM-Newton-pn and NuSTAR spectra of 1H 0419-577 fit with a power-law model corrected for Galactic absorption over the 3–5 and 7–10 keV (AGN rest-frame) energy ranges and then extrapolated over the 0.3–79 keV energy range. May 2018: XMM-Newton/pn (black) and NuSTAR (light grey). November 2018: XMM-Newton/pn (blue) and NuSTAR (light blue). |
| In the text | |
|
Fig. 2. Zoom-in on the Fe Kα line with pn data only (black: May 2018, and blue: November 2018). |
| In the text | |
|
Fig. 3. Residuals from a continuum (comptt plus powerlaw) model corrected for Galactic absorption applied to the combined 2018 RGSspectrum. |
| In the text | |
|
Fig. 4. Fit of the broad O VII emission line with a relativistic line model applied to the combined 2018 RGS spectrum. |
| In the text | |
|
Fig. 5. Fits above 3 keV of the two 2018 simultaneous XMM-Newton/pn and NuSTAR spectra and of the 2015 NuSTAR spectra. The corresponding fit parameters are reported in Table 3. Black: May 2018 XMM-Newton/pn and NuSTAR data. Blue: November 2018 XMM-Newton/pn and NuSTAR data. Green: June 2015 NuSTAR data. Top panel: ZCUTOFFPL model. Middle panel: RELXILLCP model. Bottom panel: REFLKERRD model. |
| In the text | |
|
Fig. 6. Data-to-model ratio of the two simultaneous May (black) and November (blue) 2018 XMM-Newton/pn and NuSTAR spectra over the 0.3–79 keV energy range, fit with the RELFLKERRD model. Top panel: The disc density (in log scale) is set to the default value of 15. The corresponding parameter fits are reported in the second column of Table 4. Bottom panel: Both the disc density and the accretion disc inclination were free to vary. The corresponding parameter fits are reported in the third column of Table 6. |
| In the text | |
|
Fig. 7. SED fit from UV to hard X-rays of 1H 0419-577 using the RELAGN+REFLKERRD model for the May (black) and November (blue) 2018 simultaneous XMM-Newton and NuSTAR. The values of the best-fit parameters are reported in Table 5. Top panel: Data-to-model ratio. Bottom panel: Intrinsic SED corrected for reddening and Galactic absorption (solid curves), with the main individual emission components: Outer disc (dotted curves), warm optically thick Comptonisation (dashed curves; warm corona), hot optically thin Comptonisation (dash-dotted curves; hot corona), and relativistic reflection (three-dotted-dashed curves). For clarity, the weak narrow Gaussian linecomponent is not displayed. |
| In the text | |
|
Fig. A.1. Data-to-model ratio of the two simultaneous May (black) and November (blue) 2018 XMM-Newton/pn and NuSTAR spectra over the 0.3–79 keV energy range fit with the RELXILLCP model. Top panel: The disc density (in log scale) was set to the default value of 15. The corresponding parameter fits are reported in Table A.1 second column. Bottom panel: The disc density and the accretion disc inclination were free to vary. The corresponding parameter fits are reported in Table A.1 third column. |
| In the text | |
|
Fig. B.1. Data-to-model ratio of the two 2018 0.3-79 keV simultaneous XMM-Newton-pn (black) and NuSTAR (blue) spectrum of 1H 0419-577 fit using a simplistic hybrid model combining the COMPTT (warm corona) and REFLKERRD (hot corona and relativistic reflection) models (see Table B.1 and Sect. 3.4.2 for details). |
| In the text | |
|
Fig. C.1. Data-to-model ratio of the fits using the REXCOR model grids for the May 2018 (black) and November 2018 (blue) simultaneous XMM-Newton and NuSTAR spectra. The inferred parameter values are reported in Table C.1. Top left panel: Model calculated for a spin of 0.99 and a hot corona height of 5 Rg (χ2/d.o.f.=1871.5/1437). Top right panel: Model calculated for a spin of 0.99 and a hot corona height of 20 Rg (χ2/d.o.f. = 1864.8/1437). Bottom left panel: Model calculated for a spin of 0.90 and a hot corona height of 5 Rg (χ2/d.o.f. = 1957.1/1437). Bottom right panel: Model calculated for a spin of 0.90 and a hot corona height of 20 Rg (χ2/d.o.f. = 1970.8/1437). |
| In the text | |
Current usage metrics show cumulative count of Article Views (full-text article views including HTML views, PDF and ePub downloads, according to the available data) and Abstracts Views on Vision4Press platform.
Data correspond to usage on the plateform after 2015. The current usage metrics is available 48-96 hours after online publication and is updated daily on week days.
Initial download of the metrics may take a while.