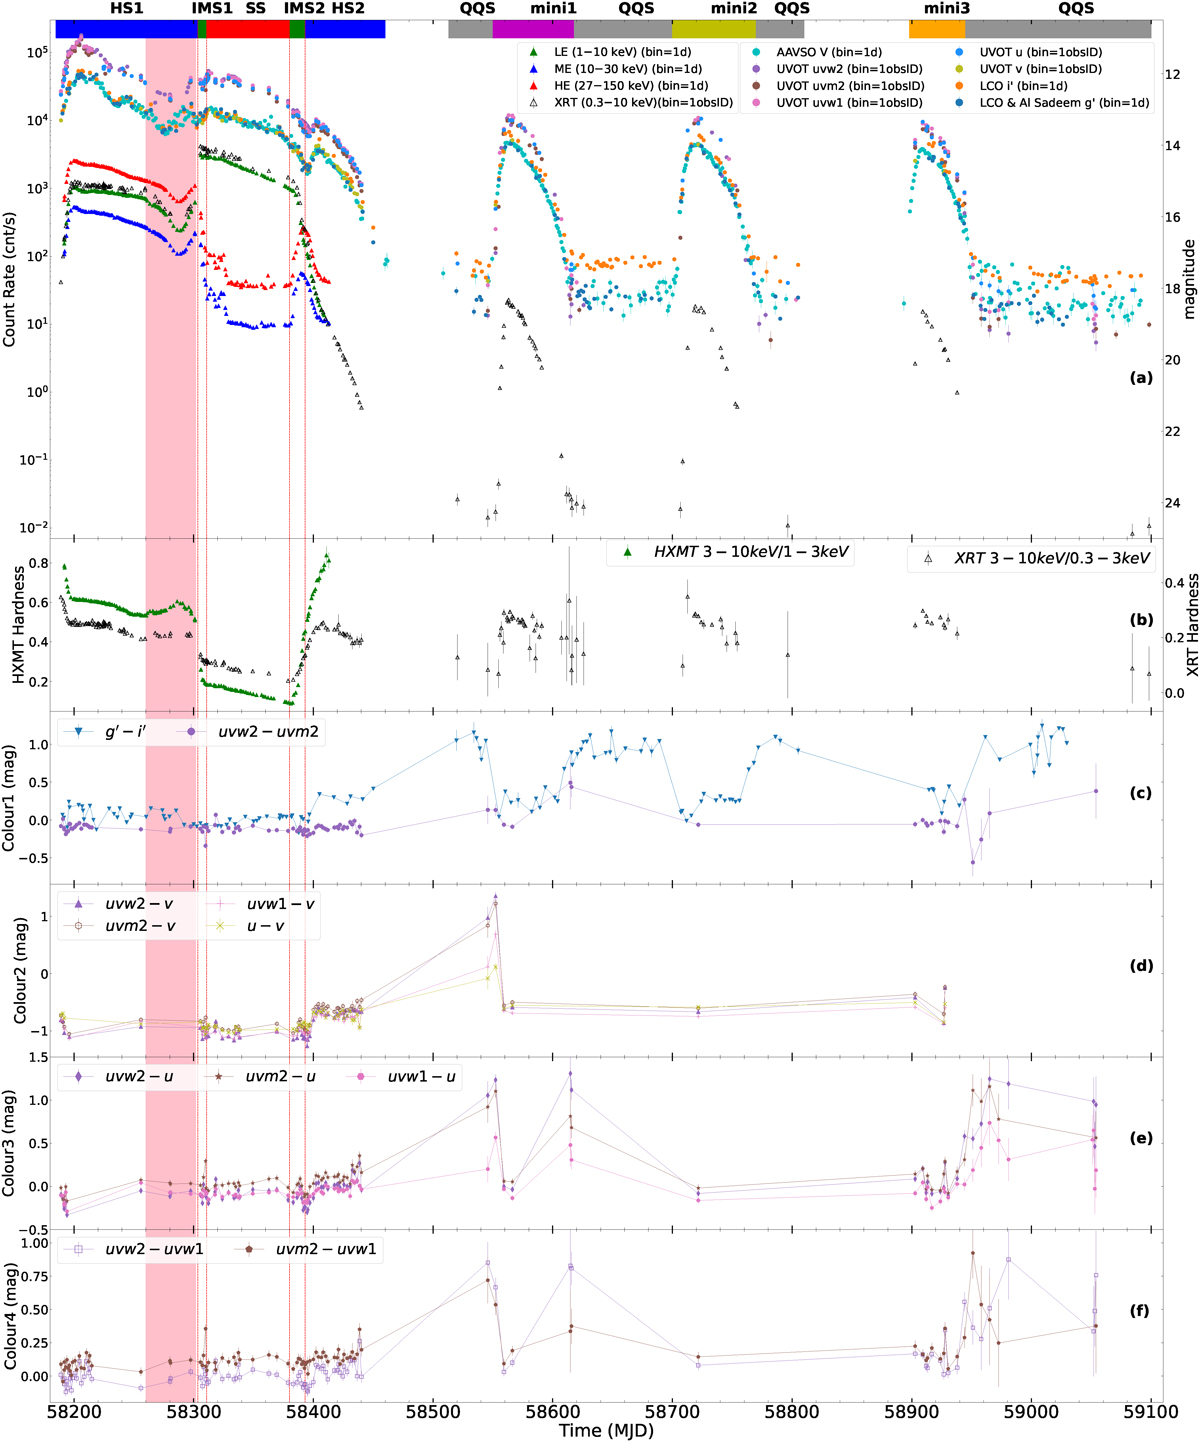
Fig. 1.
Download original image
Multi-wavelength light curves, X-ray hardness, and optical/UV colours based on Insight-HXMT, Swift and LCO, AAVSO observations of MAXI J1820+070. (a): Optical, UV, and X-ray light curves. (b): Hardness ratios from Insight-HXMT/LE and Swift/XRT. (c)–(f): Optical/UV colours defined by the magnitude difference between the optical or UV high-frequency and low-frequency bands. Note: (1) The different colours of bars at the top of panel (a) are used to differentiate the states of the main outburst, quasi-quiescent states, and three mini-outbursts. ‘mini1’, ‘mini2’, and ‘mini3’ represent the three mini-outbursts, respectively. The other acronyms are explained in the text. The QQS epochs are defined as periods when the g′-band magnitude is fainter than 17.9. (2) The shaded pink region denotes the period of the optical and X-ray dip events. (3) The interval between the first two vertical dashed red lines at MJD ∼ 58303.5 and 58310.7 denotes the period of the HS-to-SS transition. (4) The last two vertical dashed red lines at MJD ∼ 58380.0 and 58393.0 indicate the period of the SS-to-HS transition.
Current usage metrics show cumulative count of Article Views (full-text article views including HTML views, PDF and ePub downloads, according to the available data) and Abstracts Views on Vision4Press platform.
Data correspond to usage on the plateform after 2015. The current usage metrics is available 48-96 hours after online publication and is updated daily on week days.
Initial download of the metrics may take a while.