| Issue |
A&A
Volume 700, August 2025
|
|
|---|---|---|
| Article Number | A79 | |
| Number of page(s) | 15 | |
| Section | Astrophysical processes | |
| DOI | https://doi.org/10.1051/0004-6361/202555089 | |
| Published online | 08 August 2025 | |
Evidence for enhanced mass transfer in the disc preceding the transition to the soft state in MAXI J1820+070
1
Kapteyn Astronomical Institute, University of Groningen, PO Box 800 NL-9700 AV Groningen, The Netherlands
2
Yunnan Observatories, Chinese Academy of Sciences, Kunming 650216, PR China
3
Key Laboratory for the Structure and Evolution of Celestial Objects, Chinese Academy of Sciences Kunming 650216, PR China
4
Center for Astrophysics and Space Science (CASS), New York University Abu Dhabi, PO Box 129188 Abu Dhabi, UAE
5
INAF, Osservatorio Astronomico di Brera, Via E. Bianchi 46, I-23807 Merate, (LC), Italy
6
School of Physics and Astronomy, University of Southampton, Southampton, Hampshire SO17 1BJ, UK
7
Graduate Institute of Astronomy, National Central University, 300 Zhongda Road, Zhongli, Taoyuan 32001, Taiwan
8
Laboratory for Space Research, The University of Hong Kong, Cyberport 4, Hong Kong
⋆ Corresponding authors: This email address is being protected from spambots. You need JavaScript enabled to view it.
, This email address is being protected from spambots. You need JavaScript enabled to view it.
, This email address is being protected from spambots. You need JavaScript enabled to view it.
Received:
8
April
2025
Accepted:
20
June
2025
Abstract
We investigate the 2018–2019 main outburst and the subsequent mini-outbursts of the black hole low-mass X-ray binary MAXI J1820+070 using optical/ultraviolet data from the Las Cumbres Observatory (LCO), the American Association of Variable Star Observers (AAVSO), and Swift/UVOT, as well as X-ray data from Insight-HXMT and Swift/XRT. Given the high-cadence observations, we identify a broad dip-like feature in both the optical and X-ray light curves preceding the transition to the soft state, with the X-ray dip lagging the optical dip by approximately 10 days. We propose that the dip is caused by a brief decrease followed by an increase in the mass accretion rate as it propagates through the disc, ultimately triggering the transition to the soft state. This might be a potential tool to predict impending hard-to-soft state transitions, although such a dip has not yet been observed in many sources. Additionally, we find that the optical colour (g′−i′) becomes bluer and less variable before the transition to the intermediate state, preceding a dramatic change in the hardness ratio. This appears to be an unusual case, differing from the typical scenario in which the optical colour changes along with the transition to the soft state. Finally, we explore the implications of the complex evolution of optical/X-ray correlation during both main outbursts and mini-outbursts. In particular, we find a loop-like evolutionary track before the transition to the soft state, which is linked to optical/X-ray dips in the light curves.
Key words: accretion / accretion disks / stars: black holes / X-rays: binaries / X-rays: individuals: MAXI J1820+070
© The Authors 2025
 Open Access article, published by EDP Sciences, under the terms of the Creative Commons Attribution License (https://creativecommons.org/licenses/by/4.0), which permits unrestricted use, distribution, and reproduction in any medium, provided the original work is properly cited.
This article is published in open access under the Subscribe to Open model. This email address is being protected from spambots. You need JavaScript enabled to view it. to support open access publication.
1. Introduction
Black hole low-mass X-ray binaries (BH-LMXBs) are systems in which a stellar-mass black hole (BH) accretes material from a non-degenerate companion star, typically with a mass of ≤1 M⊙, via an accretion disc surrounding the BH. Most BH-LMXBs are transient sources, exhibiting bright outbursts that last weeks to months, interspersed with quiescent periods that can persist for years (e.g., Chen et al. 1997; Tetarenko et al. 2016; Bahramian & Degenaar 2023). These outbursts are believed to be driven by thermal-viscous instability in the accretion disc (e.g., Lasota 2001). During an outburst, the brightness of these transient systems scales with the mass accretion rate, making it several orders of magnitude brighter than in quiescence (e.g. Lyubarskii 1997; Bahramian & Degenaar 2023).
BH-LMXBs emit radiation across the broadband electromagnetic spectrum during outbursts. The radio emission is believed to originate from synchrotron radiation of electrons in a relativistic, collimated outflow or jet. The spectra of these systems from the ultraviolet (UV) to the near-infrared bands are more complex, as these wavelengths lie at the intersection of multiple competing emission mechanisms. For instance, these mechanisms may include X-ray reprocessing either by the companion star surface or by the outer accretion disc, viscous heating from the outer accretion disc, synchrotron emission from the jet, or synchrotron radiation in a hot flow (Shakura & Sunyaev 1973; Cunningham 1976; van Paradijs & McClintock 1994; Russell et al. 2006; Veledina et al. 2013). The X-ray spectrum is typically attributed to two main components: a thermal component and a non-thermal component. The thermal component is thought to originate from a geometrically thin, optically thick accretion disc (Shakura & Sunyaev 1973) that can be described by a multi-colour disc blackbody (Mitsuda et al. 1984), with a peak blackbody temperature varying between 0.1 keV and 2.5 keV (Zhang et al. 1997). The non-thermal component is generally thought to arise from a hot electron plasma, often referred to as the corona, through inverse Compton scattering of the soft photons from the accretion disc or synchrotron emission of the relativistic electrons (e.g. Galeev et al. 1979; Poutanen et al. 2018). This component can be characterised by a power law with an exponential cut-off at tens to hundreds of kilo-electronvolts (e.g. Sunyaev & Truemper 1979; Sunyaev & Titarchuk 1980). Despite decades of studies, there is still no consensus on the detailed geometry of the corona.
Most BH-LMXBs exhibit almost consistent behaviour during outbursts, tracing an anti-clockwise ‘q’ shape in the hardness-intensity diagram (e.g., Homan et al. 2001; Belloni et al. 2006). Based on distinct X-ray spectral and variability properties, two commonly used state classification schemes have been proposed to describe the outburst evolution: one by Homan & Belloni (2005) and another by Remillard & McClintock (2006). The former emphasises the transitions between states (see also Belloni & Motta 2016, for review), while the latter puts more emphasis on ‘stable’ states. In this work, we adopt definitions from both schemes. At the beginning of the outburst, the source is in the hard state (HS), in which the X-ray spectrum is dominated by Comptonised power-law emission from the corona. During this phase, a compact jet can usually be detected. As the luminosity increases, the X-ray spectrum softens as the hard corona flux decreases and the soft disc flux increases. When the thermal and non-thermal spectral components contribute comparably, the source enters the intermediate state (IMS), at the end of which one or more relativistic and discrete jets are launched (e.g. Fender et al. 2004). The IMS can be further subdivided into a hard intermediate state (HIMS) and a soft intermediate state (SIMS). The evolution continues until the thermal disc dominates the X-ray spectrum, coinciding with the jet quenching and, in some sources, the emergence of the X-ray wind. At this stage, the system is said to be in the soft state (SS). Eventually, as the outburst declines, the source goes back to the HS as it returns to quiescence.
The X-ray variability features that indicate different states can be described and quantified by the properties of the power density spectrum (PDS) (see Belloni 2010, for review). Here, we briefly summarise the types of quasi-periodic oscillations (QPOs) and the root-mean-square (rms) amplitude of the PDS in different states. There is a strong rapid X-ray variability with typical rms values of approximately 30% in the HS. During the HIMS, the rms decreases to around 10−20%. Type-C low-frequency QPOs usually emerge at the end of HS and during HIMS. At the onset of SIMS, Type-B QPOs replace the Type-C QPOs (e.g. Ma et al. 2023). The variability in this state can be as low as a few percent. In the SS, the rapid X-ray variability is much weaker, with rms values of ≲1%.
Most BH-LMXB outbursts undergo transitions between these states, known as full outbursts, while some outbursts, called ‘failed-transition’ (FT) outbursts, remain confined to the HS or reach only up to the HIMS (e.g. Tetarenko et al. 2016; Alabarta et al. 2021). The precise physical mechanism triggering the state transition remains an open question. The state transition process typically occurs rapidly, leaving limited observational constraints. However, multi-wavelength observations have presented several clues that may aid in predicting state transitions. Kalemci et al. (e.g. 2004) found that during SS-to-HS transitions, changes in X-ray timing properties (rms amplitude) are more pronounced than changes in the spectral properties, making them a more effective indicator of state transitions – although they lag behind spectral evolution. Fürst et al. (2015), Alabarta et al. (2021), and de Haas et al. (2021) observed a potential difference between full and FT outbursts in the radio/X-ray correlation. Alabarta et al. (2021) explored the observational difference between full and FT outbursts of GX 339–4 in the optical/infrared (IR) bands, finding that GX 339–4 appears brighter at optical/IR wavelengths before the onset of a FT outburst than before the onset of a full outburst. Lucchini et al. (2023) reported that in some BH-LMXBs, the X-ray variability, quantified by the power spectral hue (Heil et al. 2015a,b), behaves in a systematic way, evolving a few weeks ahead of the HS-to-SS transition quantified by the spectral hardness. It is also known that higher-energy emission from the compact jet, which in some sources radiates at IR or higher frequencies, quenches at the start of the state transition (Homan et al. 2005; Russell et al. 2007; Coriat et al. 2009; Baglio et al. 2018a), although there are instances of the appearance of a compact jet in the soft-intermediate state (Russell et al. 2020). Additionally, Yan & Yu (2012) found a UV flux decrease preceding the HS-to-HIMS transition, which could signify the jet quenching at higher frequencies before lower frequencies throughout the state transition.
MAXI J1820+070 is an X-ray binary initially discovered as an optical transient (ASASSN-18ey) by the All-Sky Automated Survey for SuperNovae (ASAS-SN) on UT March 06.58 2018 (MJD 58184)1 (Tucker et al. 2018). Several days later, on March 11 2018 (MJD 58188), Monitor of All-sky X-ray Image (MAXI) detected a bright X-ray transient (MAXI J1820+070) at the same location, later identified as MAXI J1820+070 (Kawamuro et al. 2018). Follow-up multi-wavelength observations confirmed that MAXI J1820+070 is a black hole X-ray binary (e.g. Baglio et al. 2018b; Bright et al. 2018; Uttley et al. 2018). MAXI J1820+070 is considered a high-inclination system, with an inclination of i = 63 ± 3° (Atri et al. 2020). The mass of the BH has been estimated to be  (Torres et al. 2020). Based on radio parallax measurements, Atri et al. (2020) derived a distance of 2.96 ± 0.33 kpc to the source. Optical spectroscopic observations determined an orbital period of 16.4518 ± 0.0002 h (Torres et al. 2019). The main outburst in 2018 remains bright in multi-wavelength for ∼200 days, undergoing full state transitions between the HS and SS (e.g. Shidatsu et al. 2019), before decaying close to quiescence (Russell et al. 2019a). Subsequently, the source experienced three evident rebrightenings in multi-wavelength without a state transition: the first (Baglio et al. 2019; Bahramian et al. 2019; Ulowetz et al. 2019; Williams et al. 2019) and second (Hambsch et al. 2019; Xu et al. 2019) in 2019, and the third (Adachi et al. 2020; Sasaki et al. 2020) in 2020. After several years of low-level activities, the latest reports indicate that the source continued to fade to a lower level in the optical, UV, and X-ray bands and finally reached quiescence in the optical band on August 5, 2023 (MJD 60161) (Homan et al. 2023; Baglio et al. 2023).
We present detailed multi-wavelength observations of the main outburst and following three mini-outbursts of MAXI J1820+070. The data and reduction methods used in this study are described in Sect. 2. The results, including the multi-wavelength light curves, X-ray hardness ratio, optical/UV colour, and optical/X-ray flux correlation, are presented in Sect. 3. In Sect. 4, we discuss our findings, including the interpretation of the optical/UV colours during both the main outburst and mini-outbursts, the propagating optical/X-ray dips occurring before the HS-to-SS transition, and the complex optical/X-ray correlations.
2. Observations and data reduction
2.1. Insight-HXMT and Swift/XRT: X-ray data
The long-term and high-cadence observations of MAXI J1820+070 by Insight-HXMT spanned from 14 March 2018 (MJD 58191) to 21 October 2018 (MJD 58412), covering Exposure IDs P0114661001*–P0114661154*. Insight-HXMT carries three instruments: the High Energy X-ray telescope (HE, 20−250 keV, Liu et al. 2020), the Medium Energy X-ray telescope (ME, 5−30 keV, Cao et al. 2020), and the Low Energy X-ray telescope (LE, 1−15 keV, Chen et al. 2020). We extracted light curves and spectra from these instruments using the Insight-HXMT Data Analysis Software (HXMTDAS) v2.062. In this study, we extracted light curves in the 1−10 keV, 10−30 keV, and 27−150 keV energy bands for the LE, ME, and HE instruments, respectively, and re-binned the light curves to 1-day bin size. We also calculated hardness ratios between the 1−3 keV and the 3−10 keV energy bands.
Additionally, we collected archival X-ray data from the X-Ray Telescope (XRT) (Burrows et al. 2005) on board Swift, including ObsIDs 00010627001–00010627226, 00010754001–00010754006, 0010774001–00010774004, 00088779001, 00813771000, 00814259000, and 00815603000 (MJD 58189–59098). Most of the XRT data we used are in the windowed-timing mode unless the observations are only in the photon-counting mode. Each observation has an average exposure time of a few kiloseconds. We used the Swift/XRT online product builder3 (Evans et al. 2009) to extract a spectrum and the average photon count rate for each observation, obtaining the X-ray light curve in the 0.3−10 keV and the hardness between the 0.3−3 keV and 3−10 keV energy bands.
To estimate the 2−10 keV X-ray fluxes used in the analysis of the optical/X-ray flux correlation, and focusing mainly on the emission from the continuum components, we adopted simplified spectral models to fit energy spectra of Insight-HXMT and Swift/XRT. Our spectral fittings were conducted with XSPEC v12.15.0 (Arnaud 1996). Using the grppha tool, we grouped the Insight-HXMT spectra with a minimum of 30 photons per bin and Swift/XRT photon counting (PC) or windowed timing (WT) mode spectra with a minimum of 20 photons per bin. Most of the Swift/XRT spectra we used were obtained in WT mode to avoid the pile-up effect present in PC mode. For the Insight-HXMT data, we used the model constant*TBabs*(diskbb+nthComp+gaussian) to fit the spectra across the 2−150 keV energy range, using the LE (2−10 keV), ME (10−30 keV), and HE (28−150 keV) telescopes. The diskbb component (Mitsuda et al. 1984) was used to characterise the multi-temperature blackbody component from the accretion disc, the nthComp component (Zdziarski et al. 1996; Życki et al. 1999) to fit the Comptonisated spectrum due to inverse Compton scattering of thermal photons in the corona, and the gaussian component to account for the broadened iron emission line around 6.4 keV. The component constant represents the cross normalisation between the three instruments; we fixed it to 1 for LE and let it free for ME and HE. We used the Tbabs component to account for interstellar absorption, with abundance tables from Wilms et al. (2000) and cross-section tables from Verner et al. (1996), with the column density fixed at NH = 0.15 × 1022 cm−2 (Uttley et al. 2018). A 1% systematic error was added to the model. For the Swift/XRT data, we adopted Tbabs*(diskbb+nthcomp) to fit the spectra across the 0.3−10 keV energy range. We used the component cflux to calculate the 2−10 keV unabsorbed X-ray fluxes from the fitted Insight-HXMT and Swift/XRT spectra, respectively, with 1σ errors. We note that, for some low-flux XRT observations where reliable spectral fitting is not possible, we estimated the upper limits of the X-ray fluxes by modelling a power-law spectrum (Γ = 1.2) using the pimms4 tool.
2.2. LCO, Al Sadeem, and AAVSO: Optical data
MAXI J1820+070 was monitored during its 2018 outburst and subsequent mini-outbursts at optical wavelengths by the Las Cumbres Observatory (LCO) telescopes, as part of an ongoing monitoring campaign of ∼50 LMXBs coordinated by the Faulkes Telescope Project (Lewis et al. 2008). Observations were carried out at the 1-m and 2-m (Faulkes) nodes of LCO. The X-ray Binary New Early Warning System (XB-NEWS) data analysis pipeline (Russell et al. 2019b; Goodwin et al. 2020; Alabarta et al., in prep.) was used for computing an astrometric solution for each image using Gaia DR2 positions, performing aperture photometry of all the stars in the image, solving for zero-point calibrations between epochs (Bramich & Freudling 2012), and flux-calibrating the photometry using the ATLAS All-Sky Stellar Reference Catalog (Tonry et al. 2018). Part of the LCO dataset on specific dates was included in multi-wavelength spectral analyses in Echiburú-Trujillo et al. (2024) and Banerjee et al. (2024), and will be included in Baglio et al. (in preparation); see Echiburú-Trujillo et al. (2024) for more details of the LCO analysis procedures. Here, we used the long-term LCO monitoring data in the SDSS g′ and i′ bands (MJD 58190–58091). We discarded the optical observations with magnitude errors > 0.25 mag, as these are non-detections or low-significance detections. We set the bin size of the light curve data to 1 day.
The source was also monitored with the Al Sadeem Observatory5. The observations were conducted using a Meade LX850 16-inch (41-cm) telescope equipped with an SBIG STT-8300 camera, along with Baader LRGB CCD filters (blue, green, and red filters with similar central wavelengths to g′, V, and R bands). For the details of the data analysis procedures, see Echiburú-Trujillo et al. (2024). In this paper, the g′-band light curve also includes some monitoring data from Al Sadeem. The full light curves of the outburst of MAXI J1820+070 from Al Sadeem will be published in Baglio et al. (in preparation).
We also included high-cadence V-band observations (MJD 58193–59091) from the American Association of Variable Star Observers (AAVSO)6. We selected only observations with an error < 0.25 mag, resulting in a total of 184 577 data points, and averaged the light curve to a 1-day bin size.
To facilitate correlation analysis, we converted g′ and V-band magnitude to flux densities, applying extinction corrections using the Fitzpatrick (1999) extinction curve. We used the colour excess E(B − V) = 0.16 (Özbey Arabacı et al. 2022), and adopted the Galactic extinction law with RV = AV/E(B − V) = 3.1. Using these parameters, we calculated the de-reddened flux densities via the tool unred7 in PyAstronomy, which implements the Fitzpatrick (1999) parametrisation.
2.3. Swift/UVOT: Optical and ultraviolet data
MAXI J1820+070 was simultaneously observed by the Ultraviolet/Optical Telescope (UVOT) on board Swift in three UVfilters (uvw2, uvm2, and uvw1) and three optical ones (u, b, and v). The b-band observations are only available for a few ObsIDs (00813771000, 00814259000, 00815603000). As a result, in this study, we used all archival Swift/UVOT monitoring data except for the b-band data. We used the HEAsoft task uvotimsum to sum the sky images for those observations with more than one image extension. To determine the flux density and magnitude of each observation using the uvotsource, we selected a circular region with a radius of 5 arcsec centred on the source, and a circular source-free region with a radius of 20 arcsec for the background subtraction. The UV/optical photometry errors were determined at a 1σ confidence level. We obtained the UVOT light curve, in which each data point represents an observation ID.
3. Results
3.1. Overall evolution of the light curves
Fig. 1a displays the Insight-HXMT light curves of MAXI J1820+070 in the X-ray band (Insight-HXMT and XRT), optical band (AAVSO/V, LCO/g′, LCO/i′, Al Sadeem/g′, u and v), and UV band (uvw2, uvm2 and uvw1). It shows that MAXI J1820+070 underwent a main outburst followed by three mini-outbursts in the multi-wavelength light curves. We refer to these observations before MJD ∼ 58460 as the main outburst. At the beginning of the main outburst phase, MAXI J1820+070 exhibits a rapid rise to its first peak across the optical, UV, and X-ray bands, with the optical and UV peaks coming approximately 5−6 days later than the X-ray peak. After the first peak, the source experiences a gradual decay without reaching quiescence, followed by two rebrightenings in the optical, UV, and X-ray bands, occurring around MJD 58290 and 58390. The first one appears just before the transition to the IMS. The second one, in the optical/UV bands, takes place shortly after the transition from a SS to a HS, and it also occurs during the soft-to-hard transition in the hard X-ray band. The source stays in the SS between these two rebrightenings. After the main outburst, three additional rebrightening events are observed in the optical, UV, and X-ray bands. Between the main outburst and the last three rebrightenings, faint observations are seen, with the average optical magnitude (g′ = 18.43) still brighter than the real quiescence (g′ = 19.64, Baglio et al. 2023). We defined these faint observations, where the g′-band magnitude is fainter than 17.9, as representing a quasi-quiescent state (QQS). We approximately treated the quasi-quiescent state as the quiescent state. Based on the three criteria – (1) the source flux reaches quiescence before the rebrightening, (2) the flux ratio between each rebrightening peak flux and the outburst peak flux is < 0.7, and (3) the ratio of the quiescent period before rebrightening to the duration of the main outburst ≤1 (see Zhang et al. 2019, for more details of the classification) – we classified the last three rebrightenings as mini-outbursts, although here the start of the quasi-quiescence after the main outburst cannot be determined well. The light curves of the mini-outbursts show a rapid rise, followed by a slightly slower decay. All three mini-outbursts have a similar peak brightness and duration. In addition, the mini-outbursts’ optical/UV peak brightness nearly reaches that of the second rebrightening of the main outburst.
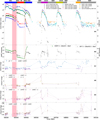 |
Fig. 1. Multi-wavelength light curves, X-ray hardness, and optical/UV colours based on Insight-HXMT, Swift and LCO, AAVSO observations of MAXI J1820+070. (a): Optical, UV, and X-ray light curves. (b): Hardness ratios from Insight-HXMT/LE and Swift/XRT. (c)–(f): Optical/UV colours defined by the magnitude difference between the optical or UV high-frequency and low-frequency bands. Note: (1) The different colours of bars at the top of panel (a) are used to differentiate the states of the main outburst, quasi-quiescent states, and three mini-outbursts. ‘mini1’, ‘mini2’, and ‘mini3’ represent the three mini-outbursts, respectively. The other acronyms are explained in the text. The QQS epochs are defined as periods when the g′-band magnitude is fainter than 17.9. (2) The shaded pink region denotes the period of the optical and X-ray dip events. (3) The interval between the first two vertical dashed red lines at MJD ∼ 58303.5 and 58310.7 denotes the period of the HS-to-SS transition. (4) The last two vertical dashed red lines at MJD ∼ 58380.0 and 58393.0 indicate the period of the SS-to-HS transition. |
3.2. X-ray hardness ratio
Fig. 1b shows the evolution of the hardness ratio over time. The changes in the hardness ratio clearly indicate the source state. We applied the definition of the spectral states of Shidatsu et al. (2019) to this study. Before MJD 58303.5 and during MJD 58393.0–58460.0, the source is in the HS (hereafter referred to as HS1 state and HS2, respectively). During MJD 58303.5–58310.7 and 58380.0–58393.0, the source is in the IMS (hereafter referred to as IMS1 state and IMS2, respectively). The source is in the SS between MJD 58310.7–58380.0. For all three mini-outbursts, compared to the hardness values during the main outburst, the source remains inthe HS.
3.3. Overall evolution of the optical and UV colours
Figs. 1c–f show different colours variations derived from optical or UV data from LCO, Al Sadeem, and UVOT. All colours are defined as the difference between the apparent magnitudes within 1 day, with the shorter wavelength minus the longer wavelength. Among these, the g′−i′ colour in Fig. 1c provides a better coverage than other colours for tracking the overallevolution.
A colour-magnitude diagram (CMD) is a useful tool for inferring disc temperatures and disentangling jet and disc emission (e.g. Maitra & Bailyn 2008; Russell et al. 2011). The disc is expected to appear bluer when brighter. If there is a jet present, that can make the data redder than the disc. Fig. 2 shows the CMD of MAXI J1820+070 throughout the main outburst, three mini-outbursts, and QQS. The entire dataset follows a general trend in which the optical colour becomes redder as it fades. It also reveals that the g′−i′ colour values during the mini-outburst are similar to the HS2 (between 0 and 0.4) of the main outburst, but it is fainter and slightly redder than in the HS1 and SS. In contrast, during the quasi-quiescence, the g′−i′ colour values are higher, ranging between ∼0.6 and 1.2. In the SS, there is a clear negative correlation between the optical colour and the optical magnitude (i.e. the optical colour becomes redder as the source gradually becomes fainter), which is expected for the emission from the accretion disc. During the HS, the CMD displays a scattered distribution that is redder than the SS track.
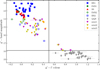 |
Fig. 2. Colour-magnitude diagram of MAXI J1820+070 showing the correlation between the g′-band magnitude and the g′−i′ colour. The horizontal line represents the threshold of quasi-quiescence (i.e. fainter than 17.9). The vertical line indicates the division of optical colour between the QQS period and the periods of the main outburst and three mini-outbursts. Data points in this figure are colour-coded according to the states defined in Fig. 1. |
Figs. 1d–f show the other UV/optical colours consisting of Swift/UVOT data. The coverage of UVOT colour is primarily during the main outburst period, which is described in detail in Sect. 3.4. We noticed that in the third mini-outburst, the UV colour becomes redder as it fade to quasi-quiescence, which is similar to the behaviour in the optical (g′−i′) colour when entering the QQS.
3.4. Colour evolution during the main outburst
In the third panel in Fig. A.1, from the relatively good coverage of the optical colour (g′−i′) colour, we observe that the variability of the optical colour is stronger in the HS than the SS. This phenomenon is also reflected in the scattering during the HS in the CMD (see Fig. 2). From Figs. 3c and d, we notice that the optical colour suddenly declines, reaching a lower value and being less variable before evolving into the IMS; meanwhile, the X-ray hardness ratio shows only minor changes. In contrast, the prominent drop in the hardness ratio appears afterwards, around the time of the transition to the SS.
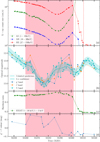 |
Fig. 3. Optical/X-ray light curves, hardness ratio, and optical colour evolution during the dip events. (a) X-ray light curves from Insight-HXMT; (b) g′, i′, V-band light curves and 3σ confidence curve of Celerite2 for the V-band light curve; (c) HXMT hardness; (d) g′−i′ colour. The pink area represents the epoch of optical and X-ray dips. The interval between the two vertical dashed red lines marks the first IMS period. |
During the period of the SS-to-HS transition in Figs. A.1c–f, especially in the last three groups of colours, the evolution of the colours consistently exhibits a pattern whereby a ‘colour bump’ appears during the transition period (between the last two vertical dashed red lines in Fig. A.1). After entering the second HS, a stronger colour bump appears.
3.5. Broad dip event before the hard-to-soft transition
As is shown in Fig. A.1a, we can see that the flux of LE, ME, and HE decrease slowly until MJD ∼ 58260. Afterwards, the flux starts to decrease faster, until MJD ∼ 58290 where the trend reverses and the flux increases back to the level observed at MJD ∼ 58260, forming a dip in the X-ray light curves. The same behaviour is observed in the optical (the UV is less well constrained), especially in the AAVSO V-band monitoring. In the V-band light curve, however, the dip appears to start (MJD ∼ 58250) earlier than in the X-ray band, reaching its minimum earlier (MJD ∼ 58275) before returning to the level observed at MJD ∼ 58250. From now on, we refer to this phenomenon as the dip observed in the X-ray and V-band light curves, marked by the shaded pink area in Fig. 3. Figs. 3a and b provides a clearer view of the optical and X-ray dip events, focusing specifically on this phase. In both the X-ray and V-bands, the dip lasts for approximately 40 days. We note that the dip events occur prior to the transition from the HS to the SS.
A delay is observed, with the X-ray dip occurring later than the optical/UV dip. The g′ and i′-band light curves show a broad dip structure, but the fall and rise that we see with LCO may be misleading, as they could simply reflect different phases of the 0.5-mag amplitude modulation reported by Thomas et al. (2022). In contrast, the monitoring in the UV band lacks coverage during the dip events, while the AAVSO provides good sampling in the V band, making it suitable for analysing the delay between the X-ray dip and the optical dips. Thomas et al. (2022) reported that the V-band light curve displays a large modulation, but the normalisation of the modulation changes around the epoch of the optical dip. We also find a clear dip structure, as shown in the prediction curve in Fig. 4b, in the V-band AAVSO light curve using the Gaussian process regression method (Foreman-Mackey et al. 2017; Foreman-Mackey 2018)8 to fit the main outburst. For the fitting prescription, we set the kernel function of the Gaussian process model to a mixture of SHOTerm terms: one quasi-periodic component and one non-periodic component.
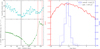 |
Fig. 4. Left panel: Dip events in the X-ray and optical light curves of MAXI J1820+070. For convenient reference to the period of the occurrence of optical superhump discussed in Thomas et al. (2022) and the X-ray/optical dips, we adopted the start date as used by them (i.e. day 0 is MJD 58188.0). The vertical solid black line (day 87) marks the onset of large-amplitude optical modulation at the superhump period. The interval between the two vertical dashed red lines is the IMS. Right panel: Cross-correlation analysis between the optical (V band) and 2−10 keV X-ray (Insight-HXMT) light curves. The red line shows the cross-correlation function (left axis). The dashed and dotted blue histograms represent the cross-correlation centroid lag distribution and the peak lag distribution, respectively (right axis). |
To analyse the time delay between the V-band and X-ray dips, we applied the interpolated cross-correlation function (ICCF) method, which has been used in time series analyses of BH-LMXBs and AGN reverberation mapping (e.g. Bentz et al. 2009; You et al. 2023). Using the ICCF analysis code9, we determined the peak time delay,  days, and centroid delay,
  days. These delays are consistent within 1σ uncertainties.
3.6. Optical/X-ray correlations
X-ray monitoring provides better coverage than the optical band; therefore, we interpolated the observed g′-band light curves (see Fig. A.2) using the interpolation method provided by the Python module scipy.interpolate.CubicSpline. This approach allowed us to make full use of the X-ray data when analysing optical/X-ray correlations. We split the complete light curve into several segments in case the Python routine was unable to obtain a smooth interpolation. After implementing the interpolation on the g′-band light curve, we used the optical data derived from the resulting interpolation curve to plot correlations with Insight-HXMT/LE and Swift/XRT data (see Figs. 5, 6 and A.3). In this study, we performed non-linear least squares fitting using the curve_fit function from SciPy. We modelled potential correlations with a power-law function of the form,  , following previous work (e.g. Russell et al. 2006, 2010a; Armas Padilla et al. 2013; López-Navas et al. 2020; Yang et al. 2022; Saikia et al. 2022), to derive slopes (β). To evaluate the significance of the correlation, we used the spearmanr function from SciPy to calculate the Spearman correlation coefficient, ρ, and the corresponding p value. The results are presented in Table 1. All correlation diagrams show complex evolutionary tracks.
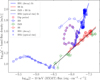 |
Fig. 5. Correlation between the 2−10 keV X-ray flux (Insight-HXMT) and the interpolated optical (g′ band) flux density during the main outburst in MAXI J1820+070. |
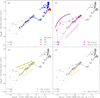 |
Fig. 6. Correlation between the 2−10 keV X-ray flux (Swift/XRT) and the interpolated optical (g′-band) flux density in MAXI J1820+070. The four panels show the main outburst and three mini-outbursts in the correlation diagram. Data points with gray arrows indicate upper limits. |
Results of the power-law fitting ( ) to the correlations between the optical (g′ band) flux density and the 2−10 keV X-ray (Swift/XRT, Insight-HXMT/LE) flux.
Fig. 5 shows the optical/X-ray correlation of the main outburst of MAXI J1820+070, using the 2−10 keV X-ray fluxes derived from Insight-HXMT spectral fitting and the g′-band optical flux densities from LCO. The resulting slopes have distinct values in different stages. During the HS1, the source first evolves from the centre of the diagram towards the upper right corner, and then towards the lower left with a very steep slope of β = 1.86 ± 0.12. We need to note that we only fitted the points on the trajectory evolving towards the lower left (i.e. the decay phase of HS1) because of the complexity of the relation in the HS1. After that, there is a clockwise loop that corresponds to the period of dip event. Given the high-cadence observation in optical and X-ray observation during the period of dip event, the loop can be also seen in the non-interpolated optical/X-ray correlation diagrams (see Figs. A.4 and A.5). A similar loop is reported in the UV/X-ray flux correlation of Swift J1910.2–0546 (see Figure 5 in Degenaar et al. 2014), although it is not clearly visible. We also fitted the correlations in the SS (β = 0.58 ± 0.03) and the optical rise phase (β = −0.29 ± 0.02) of the HS2. We obtained the same slope (β = 0.58 ± 0.02) as the one in a SS when considering the SS and IMS together.
Fig. 6 displays the correlations between the 2−10 keV Swift/XRT X-ray fluxes and the g′-band optical flux densities, revealing an extended correlation associated with the tail of the HS2 and three mini-outbursts. The upper right corner of Fig. 6a shows an evolution similar to that shown in Fig. 5. We highlight three mini-outbursts in the lower left corners of panels b–d in Fig. 6, where we find that the upper and lower tracks correspond to the rise and decay phases of the mini-outbursts, respectively. We fitted the optical/X-ray correlation during the initial rise of the HS1 and decay of the HS2, and obtained a strong correlation with a power-law index of 0.45 ± 0.01 (see Fig. A.3a). During the SSs and IMSs, we obtained results consistent with the ones derived from the g′/X-ray flux (Insight-HXMT) correlation (see the fit in Fig. A.3a). In the evolution track of the first mini-outburst, it shows that optical brightening precedes the X-ray brightening during the rising phase. For the optical/X-ray flux correlation in the three mini-outbursts (see the fit in Figs. A.3b and c), we fitted the correlation during the decay phases of the three mini-outbursts and the rise of HS1 and the decay of HS2. A highly significant correlation is observed (ρ = 0.98, p-value = 1.50 × 10−42), characterised by a power-law index of 0.45 ± 0.01. For the rising phases of the mini-outbursts, there is also a significant correlation (ρ = 0.93, p-value = 3.00 × 10⁻⁶) with a shallower power-law index of 0.26 ± 0.02.
4. Discussion
We have investigated the evolution of long-term optical, UV, and X-ray light curves of MAXI J1820+070 throughout the main outburst and followed by three mini-outbursts. We observed a broad dip event in both the X-ray and V bands before the transition from the HS to the SS, with a delay of approximately 10 days between the two bands. We analysed the optical colour evolution in the CMD. We found that, in general, the source becomes bluer as it brightens, and the colour in the HS is redder than in the SS. The colour in the quasi-quiescence varies by ∼0.5 mag. We also found that, before the HS-to-SS transition, the optical colour become stabilised earlier than the hardness ratio, and that optical/UV bumps appear during and after the transition to the HS. Finally, we analysed the complex correlations between the optical flux density and X-ray count rate during the main outburst and three mini-outbursts. In the correlation diagram (e.g. Fig. 5), we identified a distinct loop track before the transition to the SS, which has appeared in a previous study (Degenaar et al. 2014) but has never been observed with such clarity.
4.1. Interpretation of the colour evolution
From the global evolution of the g′−i′ colour in Sect. 3.3, it is apparent that in the QQS the source is redder, and in the outburst it is bluer (see Fig. 2). The general trend means that the disc in the QQS is cooler if the majority of the optical emission originates from the accretion disc during the outburst and QQS (Maitra & Bailyn 2008; Russell et al. 2011). Additionally, we observe a wide range of optical colour during QQS, indicating that the source was not in a true quiescent state and other optical emission components were contributing in that stage. Baglio et al. (2023) already reported that quiescence was entered only in 2023, and its quiescent level is known to be slightly fainter than the QQS data in the CMD.
Comparing to the SS, we find the g′−i′ colour in the HS of the main outburst and in the mini-outburst is more variable. This variability may be attributed to the rapid jet flickering (Casella et al. 2010; Gandhi et al. 2017; Baglio et al. 2018a; Paice et al. 2019, 2021; Tetarenko et al. 2021). On the one hand, the g′ and i′ data that we used to calculate the colour are within a bin size of 1 day, and rapid flickering usually occurs on timescales shorter than the exposure time (1 day) and filter switching, so the g′ and i′ data are not taken simultaneously. Therefore, the rapid jet flickering likely leads to the variable colour. Baglio et al. (in preparation) also show that optical variability in MAXI J1820+070 in the HS could be due to the jet. The HS data are also redder than the SS data, which supports the jet interpretation, since the jet component is redder than the disc component. This redder data in the CMD has also been reported in other sources (Russell et al. 2011; Baglio et al. 2020; Saikia et al. 2023a).
We see a drop and stabilisation of the g′−i′ colour preceding a dramatic change in spectral hardness, even before the transition to the IMS. The drop in the optical colour is probably due to the jet component starting to fade, which normally occurs around the same time as the start of the X-ray softening (see e.g. Russell et al. 2010b, 2013; Cadolle Bel et al. 2011; Yan & Yu 2012; Degenaar et al. 2014; Baglio et al. 2018a). However, in our case, the behaviour of the optical colour indicates the jet component fades earlier than the X-ray softening, making this an unusual situation. A similar phenomenon is also observed in Swift J1910.2−0546 (see the Figure 3 in Degenaar et al. 2014). In addition, the hot flow model predicts that the optical spectrum becomes harder when the HS-to-SS transition occurs, which is consistent with the bluer g′−i′ colour that we observed before the HS-to-SS transition (Veledina et al. 2013).
There are colour bumps that occur during and after the transition to the SS. The red colour bump that appears after the soft-to-hard transition is due to the recovery of the jet (Özbey Arabacı et al. 2022; Echiburú-Trujillo et al. 2024) that makes the energy spectrum redder. It is similar to other BH-LMXBs when they enter the HS (e.g. Kalemci et al. 2013; Russell et al. 2013; Dinçer et al. 2014; Péault et al. 2019). The smaller bump observed during IMS2 (MJD 58380.0−58393.0) is evident in the UV colours but not in the optical (g′−i′) colour, suggesting it is unlikely to be jet-related. Such a feature contradicts the expected jet behaviour, which would be more prominent in the optical band than in the UV. Moreover, jets typically do not appear in the SS, though they can emerge during the soft-to-SIMS transition (see Russell et al. 2020). Further investigation through spectral energy distribution modelling is needed, but we do not explore this in detail here.
4.2. Optical and X-ray dips
From the cross-correlation function analysis, we detect a centroid delay of  days in the X-ray dip with respect to the optical dip (Fig. 4). A similar dip was observed in Swift J1910.2−0546 (Degenaar et al. 2014; Saikia et al. 2023b), with a delay of 6−7 days. The dip in Swift J1910.2−0546 also preceded the transition to the SS, and the delay was interpreted as being due to the viscous timescale of the disc. In this scenario, the explanation for the observed delay is a mass-transfer instability that originates at the outer edge of the accretion disc and propagates inwards. Based on this scenario, we propose that a decrease in the mass accretion rate in the disc leads to a ‘gap’ forming in the matter density, followed by an increase. That gap then propagates on the viscous timescale, resulting in a UV dip followed by an X-ray dip, a hardness dip, and a transition to the SS. This process could be occurring in MAXI J1820+070, although the UV dip is not evident, probably due to the limited data coverage. We suggest that the enhanced mass transfer in the disc following the dip increases the matter density, causing the inner disc to move inwards and initiating the state transition. We suggest that the propagating dip could be a potential tool for predicting impending state transitions, although it has been observed in only two sources. Future high-cadenceoptical-UV-X-ray monitoring of suitable sources is needed to help confirm the role of the propagating dip event in state transitions and determine whether it is a common phenomenon.
The collapse and recovery of the hot flow (Veledina et al. 2013) could interpret the flux drop at longer wavelengths preceding the subsequent drop at shorter wavelengths, which seems consistent with the optical/X-ray dip observed in Swift J1910.2−0546. However, this model requires that the UV emission rises before near-infrared emission when the source transitions back to a SS, which is the opposite of the case observed in Swift J1910.2−0546 (Degenaar et al. 2014; Saikia et al. 2023b). In MAXI J1820+070, the optical rise part of the dip occurs ∼10 days before the X-ray rise. The delay between UV and optical dips is less well constrained, but optical rise also appears to occur before UV rise (see Fig. A.1). Moreover, the optical colour is bluer (i.e. the drop of g′−i′ colour) in the rise of the dip, indicating that it is the disc that is brightening, not the redder component (i.e. jet or hot flow). Therefore, collapse and recovery of the hot flow is not the cause of the optical/X-ray dip.
Interestingly, we noticed that during the optical dip event, the superhump modulation reported by Thomas et al. (2022) was detected, beginning near the optical decline reversal. This modulation exhibits the largest amplitude observed in BH-LMXBs. They suggest that such a large-amplitude modulation is caused by the disc warping, which is driven by irradiation. As we proposed above, the dip is likely due to the gap in the density in the disc. Therefore, we speculate that this warp may be related to the presence of the gap. Assuming a gap would form in the disc, it would cause a optical fading. Meanwhile, if the matter density in the gap is uneven and induces a warp formed near the minimum of the optical dip, the large-amplitude optical modulation will emerge as a result. Subsequently, due to the enhanced accretion rate, more accreting material from the outer disc flows in, filling the gap. This process could also be uneven, sustaining the warped disc. Consequently, the large-amplitude optical modulation persists while the optical flux is increasing. Eventually, the gap vanishes, and the source transitions to the SS. The disc then reaches a more stable, steady state. During this phase, the disc warping diminishes but remains present, as is indicated by the comparable large modulation measured by Thomas et al. (2022). Overall, the emergence of disc warping in MAXI J1820+070 could be related to the formation of the dip event, and lasts longer than the duration of the dip events.
4.3. Implication of optical/X-ray correlations
Investigating the optical/X-ray correlation (see Figs. 5 and 6), there are two main correlation tracks observed. One corresponds to the initial rise and final decay phases of the HS (β = 0.45 ± 0.01). The other track is in the SS and IMS (β = 0.58 ± 0.02), as is shown in the fit in Fig. A.3a. We found that, for a given X-ray flux in MAXI J1820+070, the optical flux is stronger in the HS than in the SS, which may indicate a contribution from a jet to the optical emission during the HS. The double track was also observed in other sources, such as XTE J1550−564, 4U 1543−47 (Russell et al. 2007), and GX 339−4 (Coriat et al. 2009). Below we discuss the optical/X-ray correlation of MAXI J1820+070 in different states.
During the initial rise of HS1 and final decay of HS2, the two periods follow the same track (see Fig. 6a), with a strong correlation characterised by a power-law index of 0.45 ± 0.01. In both periods, the optical emission could be dominated by X-ray reprocessing (van Paradijs & McClintock 1994, β ≈ 0.5), though the viscous disc contributions (Russell et al. 2006, β ≈ 0.3) may slightly reduce the slope below pure X-ray reprocessing predictions. Broadband spectral modelling (Echiburú-Trujillo et al. 2024) confirms significant jet contributions to optical emission. However, our the optical/X-ray correlation index is not consistent with the theoretical value of the jet model (Russell et al. 2006, β ≈ 0.7), which suggests that the jet emission is not the dominant component in the optical band. Before the source enters the final decay of HS2, it shows a negative correlation with β = −0.29 ± 0.02 (see Fig. 5), which corresponds to the rise phase of the optical flare in the HS2. You et al. (2023) reported that the optical flare was delayed by about 17 days relative to the hard X-ray flare. They suggested that the delayed optical flare is caused by a thermal-viscous instability in the outer disc, taking into account the effect of the disc wind.
During the decay of HS1, as is shown in Fig. 5, it follows a very steep slope of the optical/X-ray correlation, β = 1.86 ± 0.12, which is even higher than the prediction of the jet. The study of broad spectral energy distributions in previous work shows that the jet spectral break decreases in frequency by three orders of magnitude during the decay phase of HS1 (see Figures 2a and 3a Echiburú-Trujillo et al. 2024). Therefore, one possible interpretation for such a steep slope is that the jet spectral break is shifting down in frequency. This would cause an optical drop as the higher frequency emission from the jet fades, without fading in the X-ray or radio.
Before the transition to the SS, there is a loop-like track in the plot of Fig. 5 (corresponding to the dip period), which has never been reported in the optical/X-ray correlation analysis of any other source. The detection of this loop in the optical/X-ray correlations is seen from the optical (LCO and AAVSO) and X-ray (Insight-HXMT) observations before the transition to the SS. The loop track appears to emerge in the UVOT/XRT correlation (see Figure 5 in Stiele & Kong 2020) but this is not clear due to the lack of sufficient observations from UVOT during that period. This loop was also observed in Swift J1910.2–0546 (see Figure 5 in Degenaar et al. 2014), in which a delayed X-ray dip relative to the optical/UV dip was detected. However, it is not as clear as in our case due to the lower cadence of observation in their study. The loop indicates that the optical brightening precedes the X-ray brightening. We suggest that it is related to an increase in the mass accretion rate in the outer disc. The material then propagates inwards through the disc to the X-ray emitting region, causing the X-ray brightening and triggering the transition to the SS, as our discussion of the rise phase of the dip in Sect. 4.2. It is worth mentioning that the discovery of this loop structure is due to the high-cadence observations in the optical (LCO and AAVSO) and X-ray bands (Insight-HXMT). Conducting high-cadence, multi-wavelength observations during the outburst in the future may help us identify similar loop-like structures in other sources.
During the SS, the optical/X-ray correlation shows a power-law index of 0.58 ± 0.03 as the source fades (see Fig. 5). A combined fit of the SS and IMS yields an identical slope (β = 0.58 ± 0.02; Fig. 5). Both values are marginally higher than standard X-ray reprocessing predictions. Recent studies demonstrate that the expected slope (β) of the optical/X-ray correlation depends on the heating mechanisms (viscous vs irradiated disc) and the spectral region of the disc emission, spanning from the Rayleigh-Jeans (RJ) tail to the multi-colour blackbody plateau (Coriat et al. 2009; Tetarenko et al. 2020; Shahbaz et al. 2015). For a viscously heated disc in the SS, β ranges from 0.26 (RJ-dominated) to 0.67 (disc-dominated). In contrast, X-ray reprocessing produces a broader range of 0.28 ≤ β ≤ 1.33. Besides, the CMD (see Fig. 2) shows the SS data following what is expected for the optical emission from disc. However, the measured β ≈ 0.58 overlaps with predictions from both mechanisms, making it ambiguous to distinguish their contributions. Broadband spectral modelling resolves this ambiguity: the optical data in the SS are best described by an irradiated disc (Echiburú-Trujillo et al. 2024), strongly suggesting that X-ray reprocessing dominates the optical emission.
During the three mini-outbursts, their rise phases follow a distinct track separate from the decay phases, with the former on the upper track and the latter on the lower track (see Figs. 6c–d). On the one hand, this means that different dominant mechanisms contribute to the optical emission of the rise and decay phases, respectively. Stiele & Kong (2020) also display a similar correlation using the UVOT/XRT data, but only have a single track for mini-outbursts, likely due to the lack of data during the rise phases. The β in the rises of mini-outbursts is 0.26 ± 0.02 (see Fig. A.3b), which is consistent with the viscously heated accretion disc (Russell et al. 2006). We also notice that the rise of HS1 and the decay of HS2 align with the correlation in the decays of mini-outbursts, suggesting that the same process is responsible for producing the optical emission. We fit them together and obtain a nice optical/X-ray correlation in the decay phases with β = 0.45 ± 0.01 (see Fig. A.3c), which suggests that the optical emission is dominated by the X-ray reprocessing. On the other hand, these two separated tracks in the first mini-outburst also indicate that the optical brightening might precede the X-ray brightening. Sai et al. (2021) also estimated a time delay of 20 days between the B band and XRT (2 − 10 keV) flux in the first mini-outburst. This is expected as the heating front travels through the disc during the initial rise (e.g. Dubus et al. 2001).
5. Conclusions
In this work, we present the analysis of optical, UV, and X-ray observations of the main outburst and the subsequent mini-outbursts of the BH-LMXB MAXI J1820+070. Our main results and conclusions are:
-
We detect optical and X-ray flux dips before the hard-to-soft transition in the main outburst. There is a delay of ∼10 days between the X-ray and the optical dips. We suggest that it reflects the time it takes, on the viscous timescale, for a decrease then an increase in the mass density to propagate from the outer disc to the inner disc. The transition to a SS is likely due to the enhanced mass transfer in the disc following the dip. The propagating dip might be a possible tool for predicting the impending state transition.
-
We observe that the optical colour becomes bluer and less variable before the transition to an IMS, likely due to quenching of the variable jet. Typically, the optical colour is expected to be bluer at the same time as the X-ray spectral softening during the transition to the SS. However, this prominent change in optical colour even occurs during the HS, indicating that our finding is an unusual case.
-
We measure the steepest optical/X-ray correlation slope in BH-LMXBs to date during the decay phase of the first HS. This might be related to the jet spectral break shifting to a lower frequency.
-
We find a loop track in the optical/X-ray flux correlation diagram before the transition to the SS. This is caused by the time delay between the X-ray and optical dips. The detection of the optical/X-ray dip events and the loop track is revealed through high-cadence monitoring in the optical and X-ray band. Conducting high-cadence, multi-wavelength monitoring could help us further understand the role of dip events in the state transition.
-
We find that the rise and decay phases of mini-outbursts follow two distinct tracks, indicating that different mechanisms dominate the optical emission in each phase. The optical rising phase appears to be governed by viscous heating in the accretion disc, while the fading phase is likely dominated by X-ray reprocessing in the disc.
Acknowledgments
We thank an anonymous referee for useful comments that helped us improve the paper. We thank Thabet Al Qaissieh and Aldrin Gabuya for providing the optical data from the Al Sadeem Observatory, Abu Dhabi, UAE. DMR and PS are supported by Tamkeen under the NYU Abu Dhabi Research Institute grant CASS. GB acknowledges support from the China Manned Space Program with grant No. CMS-CSST-2025-A13. PY acknowledges support from the China Scholarship Council (CSC), No. 202304910059.
References
- Adachi, R., Murata, K. L., Oeda, M., et al. 2020, ATel, 13502, 1 [NASA ADS] [Google Scholar]
- Alabarta, K., Altamirano, D., Méndez, M., et al. 2021, MNRAS, 507, 5507 [NASA ADS] [CrossRef] [Google Scholar]
- Armas Padilla, M., Degenaar, N., Russell, D. M., & Wijnands, R. 2013, MNRAS, 428, 3083 [NASA ADS] [CrossRef] [Google Scholar]
- Arnaud, K. A. 1996, ASP Conf. Ser., 101, 17 [Google Scholar]
- Atri, P., Miller-Jones, J. C. A., Bahramian, A., et al. 2020, MNRAS, 493, L81 [CrossRef] [Google Scholar]
- Baglio, M. C., Russell, D. M., Casella, P., et al. 2018a, ApJ, 867, 114 [NASA ADS] [CrossRef] [Google Scholar]
- Baglio, M. C., Russell, D. M., & Lewis, F. 2018b, ATel, 11418, 1 [Google Scholar]
- Baglio, M. C., Russell, D. M., Qaissieh, T. A., et al. 2019, ATel, 12596, 1 [Google Scholar]
- Baglio, M. C., Russell, D. M., Crespi, S., et al. 2020, ApJ, 905, 87 [NASA ADS] [CrossRef] [Google Scholar]
- Baglio, M. C., Russell, D. M., Alabarta, K., et al. 2023, ATel, 16192, 1 [Google Scholar]
- Bahramian, A., & Degenaar, N. 2023, Handbook of X-ray and Gamma-ray Astrophysics (Springer), 120 [Google Scholar]
- Bahramian, A., Motta, S., Atri, P., & Miller-Jones, J. 2019, ATel, 12573, 1 [Google Scholar]
- Banerjee, S., Dewangan, G. C., Knigge, C., et al. 2024, ApJ, 964, 189 [NASA ADS] [CrossRef] [Google Scholar]
- Belloni, T. M. 2010, Lect. Notes Phys., 794, 53 [NASA ADS] [CrossRef] [Google Scholar]
- Belloni, T. M., & Motta, S. E. 2016, Astrophys. Space Sci. Lib., 440, 61 [Google Scholar]
- Belloni, T., Parolin, I., Del Santo, M., et al. 2006, MNRAS, 367, 1113 [NASA ADS] [CrossRef] [Google Scholar]
- Bentz, M. C., Walsh, J. L., Barth, A. J., et al. 2009, ApJ, 705, 199 [NASA ADS] [CrossRef] [Google Scholar]
- Bramich, D. M., & Freudling, W. 2012, MNRAS, 424, 1584 [CrossRef] [Google Scholar]
- Bright, J., Fender, R., & Motta, S. 2018, ATel, 11420, 1 [Google Scholar]
- Burrows, D. N., Hill, J. E., Nousek, J. A., et al. 2005, Space Sci. Rev., 120, 165 [Google Scholar]
- Cadolle Bel, M., Rodriguez, J., D’Avanzo, P., et al. 2011, A&A, 534, A119 [NASA ADS] [CrossRef] [EDP Sciences] [Google Scholar]
- Cao, X., Jiang, W., Meng, B., et al. 2020, SCPMA, 63, 249504 [Google Scholar]
- Casella, P., Maccarone, T. J., O’Brien, K., et al. 2010, MNRAS, 404, L21 [NASA ADS] [Google Scholar]
- Chen, W., Shrader, C. R., & Livio, M. 1997, ApJ, 491, 312 [NASA ADS] [CrossRef] [Google Scholar]
- Chen, Y., Cui, W., Li, W., et al. 2020, SCPMA, 63, 249505 [Google Scholar]
- Coriat, M., Corbel, S., Buxton, M. M., et al. 2009, MNRAS, 400, 123 [Google Scholar]
- Cunningham, C. 1976, ApJ, 208, 534 [NASA ADS] [CrossRef] [Google Scholar]
- de Haas, S. E. M., Russell, T. D., Degenaar, N., et al. 2021, MNRAS, 502, 521 [CrossRef] [Google Scholar]
- Degenaar, N., Maitra, D., Cackett, E. M., et al. 2014, ApJ, 784, 122 [Google Scholar]
- Dinçer, T., Kalemci, E., Tomsick, J. A., Buxton, M. M., & Bailyn, C. D. 2014, ApJ, 795, 74 [Google Scholar]
- Dubus, G., Hameury, J. M., & Lasota, J. P. 2001, A&A, 373, 251 [NASA ADS] [CrossRef] [EDP Sciences] [Google Scholar]
- Echiburú-Trujillo, C., Tetarenko, A. J., Haggard, D., et al. 2024, ApJ, 962, 116 [Google Scholar]
- Evans, P. A., Beardmore, A. P., Page, K. L., et al. 2009, MNRAS, 397, 1177 [Google Scholar]
- Fender, R. P., Belloni, T. M., & Gallo, E. 2004, MNRAS, 355, 1105 [NASA ADS] [CrossRef] [Google Scholar]
- Fitzpatrick, E. L. 1999, PASP, 111, 63 [Google Scholar]
- Foreman-Mackey, D. 2018, Res. Notes Am. Astron. Soc., 2, 31 [NASA ADS] [Google Scholar]
- Foreman-Mackey, D., Agol, E., Ambikasaran, S., & Angus, R. 2017, AJ, 154, 220 [Google Scholar]
- Fürst, F., Nowak, M. A., Tomsick, J. A., et al. 2015, ApJ, 808, 122 [Google Scholar]
- Galeev, A. A., Rosner, R., & Vaiana, G. S. 1979, ApJ, 229, 318 [NASA ADS] [CrossRef] [Google Scholar]
- Gandhi, P., Bachetti, M., Dhillon, V. S., et al. 2017, Nat. Astron., 1, 859 [NASA ADS] [CrossRef] [Google Scholar]
- Goodwin, A. J., Russell, D. M., Galloway, D. K., et al. 2020, MNRAS, 498, 3429 [NASA ADS] [CrossRef] [Google Scholar]
- Hambsch, J., Ulowetz, J., Vanmunster, T., Cejudo, D., & Patterson, J. 2019, ATel, 13014, 1 [NASA ADS] [Google Scholar]
- Heil, L. M., Uttley, P., & Klein-Wolt, M. 2015a, MNRAS, 448, 3348 [Google Scholar]
- Heil, L. M., Uttley, P., & Klein-Wolt, M. 2015b, MNRAS, 448, 3339 [NASA ADS] [CrossRef] [Google Scholar]
- Homan, J., & Belloni, T. 2005, Ap&SS, 300, 107 [Google Scholar]
- Homan, J., Wijnands, R., van der Klis, M., et al. 2001, ApJS, 132, 377 [NASA ADS] [CrossRef] [Google Scholar]
- Homan, J., Buxton, M., Markoff, S., et al. 2005, ApJ, 624, 295 [NASA ADS] [CrossRef] [Google Scholar]
- Homan, J., Baglio, M. C., Saikia, P., et al. 2023, ATel, 16200, 1 [Google Scholar]
- Kalemci, E., Tomsick, J. A., Rothschild, R. E., Pottschmidt, K., & Kaaret, P. 2004, ApJ, 603, 231 [Google Scholar]
- Kalemci, E., Dinçer, T., Tomsick, J. A., et al. 2013, ApJ, 779, 95 [NASA ADS] [CrossRef] [Google Scholar]
- Kawamuro, T., Negoro, H., Yoneyama, T., et al. 2018, ATel, 11399, 1 [Google Scholar]
- Lasota, J.-P. 2001, New Astron. Rev., 45, 449 [Google Scholar]
- Lewis, F., Russell, D. M., Fender, R. P., Roche, P., & Clark, J. S. 2008, ArXiv e-prints [arXiv:0811.2336] [Google Scholar]
- Liu, C., Zhang, Y., Li, X., et al. 2020, SCPMA, 63, 249503 [Google Scholar]
- López-Navas, E., Degenaar, N., Parikh, A. S., Hernández Santisteban, J. V., & van den Eijnden, J. 2020, MNRAS, 493, 940 [CrossRef] [Google Scholar]
- Lucchini, M., Ten Have, M., Wang, J., et al. 2023, ApJ, 958, 153 [Google Scholar]
- Lyubarskii, Y. E. 1997, MNRAS, 292, 679 [Google Scholar]
- Ma, R., Méndez, M., García, F., et al. 2023, MNRAS, 525, 854 [CrossRef] [Google Scholar]
- Maitra, D., & Bailyn, C. D. 2008, ApJ, 688, 537 [Google Scholar]
- Mitsuda, K., Inoue, H., Koyama, K., et al. 1984, PASJ, 36, 741 [NASA ADS] [Google Scholar]
- Özbey Arabacı, M., Kalemci, E., Dinçer, T., et al. 2022, MNRAS, 514, 3894 [Google Scholar]
- Paice, J. A., Gandhi, P., Shahbaz, T., et al. 2019, MNRAS, 490, L62 [NASA ADS] [CrossRef] [Google Scholar]
- Paice, J. A., Gandhi, P., Shahbaz, T., et al. 2021, MNRAS, 505, 3452 [NASA ADS] [CrossRef] [Google Scholar]
- Péault, M., Malzac, J., Coriat, M., et al. 2019, MNRAS, 482, 2447 [CrossRef] [Google Scholar]
- Poutanen, J., Veledina, A., & Zdziarski, A. A. 2018, A&A, 614, A79 [NASA ADS] [CrossRef] [EDP Sciences] [Google Scholar]
- Remillard, R. A., & McClintock, J. E. 2006, ARA&A, 44, 49 [Google Scholar]
- Russell, D. M., Fender, R. P., Hynes, R. I., et al. 2006, MNRAS, 371, 1334 [NASA ADS] [CrossRef] [Google Scholar]
- Russell, D. M., Maccarone, T. J., Körding, E. G., & Homan, J. 2007, MNRAS, 379, 1401 [Google Scholar]
- Russell, D. M., Lewis, F., Roche, P., et al. 2010a, MNRAS, 402, 2671 [Google Scholar]
- Russell, D. M., Maitra, D., Dunn, R. J. H., & Markoff, S. 2010b, MNRAS, 405, 1759 [NASA ADS] [Google Scholar]
- Russell, D. M., Maitra, D., Dunn, R. J. H., & Fender, R. P. 2011, MNRAS, 416, 2311 [Google Scholar]
- Russell, D. M., Russell, T. D., Miller-Jones, J. C. A., et al. 2013, ApJ, 768, L35 [NASA ADS] [CrossRef] [Google Scholar]
- Russell, D. M., Baglio, M. C., & Lewis, F. 2019a, ATel, 12534, 1 [NASA ADS] [Google Scholar]
- Russell, D. M., Bramich, D. M., Lewis, F., et al. 2019b, Astron. Nachr., 340, 278 [NASA ADS] [CrossRef] [Google Scholar]
- Russell, D. M., Casella, P., Kalemci, E., et al. 2020, MNRAS, 495, 182 [NASA ADS] [CrossRef] [Google Scholar]
- Sai, H., Wang, X., Wu, J., et al. 2021, MNRAS, 504, 4226 [CrossRef] [Google Scholar]
- Saikia, P., Russell, D. M., Baglio, M. C., et al. 2022, ApJ, 932, 38 [NASA ADS] [CrossRef] [Google Scholar]
- Saikia, P., Russell, D. M., Pirbhoy, S. F., et al. 2023a, ApJ, 949, 104 [Google Scholar]
- Saikia, P., Russell, D. M., Pirbhoy, S. F., et al. 2023b, MNRAS, 524, 4543 [Google Scholar]
- Sasaki, R., Negoro, H., Nakahira, S., et al. 2020, ATel, 13530, 1 [Google Scholar]
- Shahbaz, T., Linares, M., Nevado, S. P., et al. 2015, MNRAS, 453, 3461 [Google Scholar]
- Shakura, N. I., & Sunyaev, R. A. 1973, A&A, 24, 337 [NASA ADS] [Google Scholar]
- Shidatsu, M., Nakahira, S., Murata, K. L., et al. 2019, ApJ, 874, 183 [NASA ADS] [CrossRef] [Google Scholar]
- Stiele, H., & Kong, A. K. H. 2020, ApJ, 889, 142 [NASA ADS] [CrossRef] [Google Scholar]
- Sunyaev, R. A., & Titarchuk, L. G. 1980, A&A, 86, 121 [NASA ADS] [Google Scholar]
- Sunyaev, R. A., & Truemper, J. 1979, Nature, 279, 506 [NASA ADS] [CrossRef] [Google Scholar]
- Tetarenko, B. E., Sivakoff, G. R., Heinke, C. O., & Gladstone, J. C. 2016, ApJS, 222, 15 [Google Scholar]
- Tetarenko, B. E., Dubus, G., Marcel, G., Done, C., & Clavel, M. 2020, MNRAS, 495, 3666 [Google Scholar]
- Tetarenko, A. J., Casella, P., Miller-Jones, J. C. A., et al. 2021, MNRAS, 504, 3862 [NASA ADS] [CrossRef] [Google Scholar]
- Thomas, J. K., Charles, P. A., Buckley, D. A. H., et al. 2022, MNRAS, 509, 1062 [Google Scholar]
- Tonry, J. L., Denneau, L., Flewelling, H., et al. 2018, ApJ, 867, 105 [NASA ADS] [CrossRef] [Google Scholar]
- Torres, M. A. P., Casares, J., Jiménez-Ibarra, F., et al. 2019, ApJ, 882, L21 [NASA ADS] [CrossRef] [Google Scholar]
- Torres, M. A. P., Casares, J., Jiménez-Ibarra, F., et al. 2020, ApJ, 893, L37 [NASA ADS] [CrossRef] [Google Scholar]
- Tucker, M. A., Shappee, B. J., Holoien, T. W. S., et al. 2018, ApJ, 867, L9 [NASA ADS] [CrossRef] [Google Scholar]
- Ulowetz, J., Myers, G., & Patterson, J. 2019, ATel, 12567, 1 [NASA ADS] [Google Scholar]
- Uttley, P., Gendreau, K., Markwardt, C., et al. 2018, ATel, 11423, 1 [NASA ADS] [Google Scholar]
- van Paradijs, J., & McClintock, J. E. 1994, A&A, 290, 133 [NASA ADS] [Google Scholar]
- Veledina, A., Poutanen, J., & Vurm, I. 2013, MNRAS, 430, 3196 [NASA ADS] [CrossRef] [Google Scholar]
- Verner, D. A., Ferland, G. J., Korista, K. T., & Yakovlev, D. G. 1996, ApJ, 465, 487 [Google Scholar]
- Williams, D., Motta, S., Bright, J., et al. 2019, ATel, 12577, 1 [Google Scholar]
- Wilms, J., Allen, A., & McCray, R. 2000, ApJ, 542, 914 [Google Scholar]
- Xu, Y., Harrison, F., & Tomsick, J. 2019, ATel, 13025, 1 [Google Scholar]
- Yan, Z., & Yu, W. 2012, MNRAS, 427, L11 [Google Scholar]
- Yang, P., Zhang, G., Russell, D. M., et al. 2022, MNRAS, 514, 234 [NASA ADS] [CrossRef] [Google Scholar]
- You, B., Cao, X., Yan, Z., et al. 2023, Science, 381, 961 [Google Scholar]
- Zdziarski, A. A., Johnson, W. N., & Magdziarz, P. 1996, MNRAS, 283, 193 [NASA ADS] [CrossRef] [Google Scholar]
- Zhang, S. N., Mirabel, I. F., Harmon, B. A., et al. 1997, AIP Conf. Ser., 410, 141 [Google Scholar]
- Zhang, G. B., Bernardini, F., Russell, D. M., et al. 2019, ApJ, 876, 5 [Google Scholar]
- Życki, P. T., Done, C., & Smith, D. A. 1999, MNRAS, 309, 561 [Google Scholar]
Appendix A: Additional material
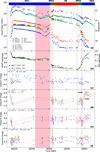 |
Fig. A.1. Multi-wavelength light curves, X-ray hardness and optical/UV colours during the main outburst of MAXI J1820+070. |
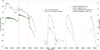 |
Fig. A.2. Interpolation on g′ band light curves of MAXI J1820+070. Gray circles and gray stars are the interpolation at the Insight-HXMT and XRT observation time, respectively. |
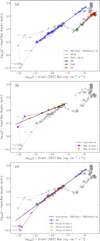 |
Fig. A.3. Power-law fits to the correlations between the 2–10 keV Swift/XRT X-ray flux and the interpolated g′-band flux density of MAXI J1820+070. (a): Joint fit to the initial rise of HS1 and the final decay of HS2, and a separate fit to the IMS and SS phases. (b): Joint fit to the rise phases of mini-outbursts 1 and 2. (c): Joint fit to the initial rise of HS1, the final decay of HS2, and the decay phases of mini-outbursts 1, 2, and 3. Note: The upper-limit points are not included in the fitting of (c). |
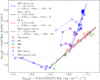 |
Fig. A.4. Power-law fits to the correlations between the 2-10 keV X-ray (Insight-HXMT) flux and the non-interpolated optical (g′ band) flux density during the main outburst in MAXI J1820+070. |
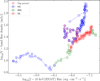 |
Fig. A.5. Correlations between the 2-10 keV X-ray (Insight-HXMT) flux and the optical (V band) flux density during the main outburst in MAXI J1820+070. |
All Tables
Results of the power-law fitting () to the correlations between the optical (g′ band) flux density and the 2−10 keV X-ray (Swift/XRT, Insight-HXMT/LE) flux.
All Figures
|
Fig. 1. Multi-wavelength light curves, X-ray hardness, and optical/UV colours based on Insight-HXMT, Swift and LCO, AAVSO observations of MAXI J1820+070. (a): Optical, UV, and X-ray light curves. (b): Hardness ratios from Insight-HXMT/LE and Swift/XRT. (c)–(f): Optical/UV colours defined by the magnitude difference between the optical or UV high-frequency and low-frequency bands. Note: (1) The different colours of bars at the top of panel (a) are used to differentiate the states of the main outburst, quasi-quiescent states, and three mini-outbursts. ‘mini1’, ‘mini2’, and ‘mini3’ represent the three mini-outbursts, respectively. The other acronyms are explained in the text. The QQS epochs are defined as periods when the g′-band magnitude is fainter than 17.9. (2) The shaded pink region denotes the period of the optical and X-ray dip events. (3) The interval between the first two vertical dashed red lines at MJD ∼ 58303.5 and 58310.7 denotes the period of the HS-to-SS transition. (4) The last two vertical dashed red lines at MJD ∼ 58380.0 and 58393.0 indicate the period of the SS-to-HS transition. |
| In the text | |
|
Fig. 2. Colour-magnitude diagram of MAXI J1820+070 showing the correlation between the g′-band magnitude and the g′−i′ colour. The horizontal line represents the threshold of quasi-quiescence (i.e. fainter than 17.9). The vertical line indicates the division of optical colour between the QQS period and the periods of the main outburst and three mini-outbursts. Data points in this figure are colour-coded according to the states defined in Fig. 1. |
| In the text | |
|
Fig. 3. Optical/X-ray light curves, hardness ratio, and optical colour evolution during the dip events. (a) X-ray light curves from Insight-HXMT; (b) g′, i′, V-band light curves and 3σ confidence curve of Celerite2 for the V-band light curve; (c) HXMT hardness; (d) g′−i′ colour. The pink area represents the epoch of optical and X-ray dips. The interval between the two vertical dashed red lines marks the first IMS period. |
| In the text | |
|
Fig. 4. Left panel: Dip events in the X-ray and optical light curves of MAXI J1820+070. For convenient reference to the period of the occurrence of optical superhump discussed in Thomas et al. (2022) and the X-ray/optical dips, we adopted the start date as used by them (i.e. day 0 is MJD 58188.0). The vertical solid black line (day 87) marks the onset of large-amplitude optical modulation at the superhump period. The interval between the two vertical dashed red lines is the IMS. Right panel: Cross-correlation analysis between the optical (V band) and 2−10 keV X-ray (Insight-HXMT) light curves. The red line shows the cross-correlation function (left axis). The dashed and dotted blue histograms represent the cross-correlation centroid lag distribution and the peak lag distribution, respectively (right axis). |
| In the text | |
|
Fig. 5. Correlation between the 2−10 keV X-ray flux (Insight-HXMT) and the interpolated optical (g′ band) flux density during the main outburst in MAXI J1820+070. |
| In the text | |
|
Fig. 6. Correlation between the 2−10 keV X-ray flux (Swift/XRT) and the interpolated optical (g′-band) flux density in MAXI J1820+070. The four panels show the main outburst and three mini-outbursts in the correlation diagram. Data points with gray arrows indicate upper limits. |
| In the text | |
|
Fig. A.1. Multi-wavelength light curves, X-ray hardness and optical/UV colours during the main outburst of MAXI J1820+070. |
| In the text | |
|
Fig. A.2. Interpolation on g′ band light curves of MAXI J1820+070. Gray circles and gray stars are the interpolation at the Insight-HXMT and XRT observation time, respectively. |
| In the text | |
|
Fig. A.3. Power-law fits to the correlations between the 2–10 keV Swift/XRT X-ray flux and the interpolated g′-band flux density of MAXI J1820+070. (a): Joint fit to the initial rise of HS1 and the final decay of HS2, and a separate fit to the IMS and SS phases. (b): Joint fit to the rise phases of mini-outbursts 1 and 2. (c): Joint fit to the initial rise of HS1, the final decay of HS2, and the decay phases of mini-outbursts 1, 2, and 3. Note: The upper-limit points are not included in the fitting of (c). |
| In the text | |
|
Fig. A.4. Power-law fits to the correlations between the 2-10 keV X-ray (Insight-HXMT) flux and the non-interpolated optical (g′ band) flux density during the main outburst in MAXI J1820+070. |
| In the text | |
|
Fig. A.5. Correlations between the 2-10 keV X-ray (Insight-HXMT) flux and the optical (V band) flux density during the main outburst in MAXI J1820+070. |
| In the text | |
Current usage metrics show cumulative count of Article Views (full-text article views including HTML views, PDF and ePub downloads, according to the available data) and Abstracts Views on Vision4Press platform.
Data correspond to usage on the plateform after 2015. The current usage metrics is available 48-96 hours after online publication and is updated daily on week days.
Initial download of the metrics may take a while.