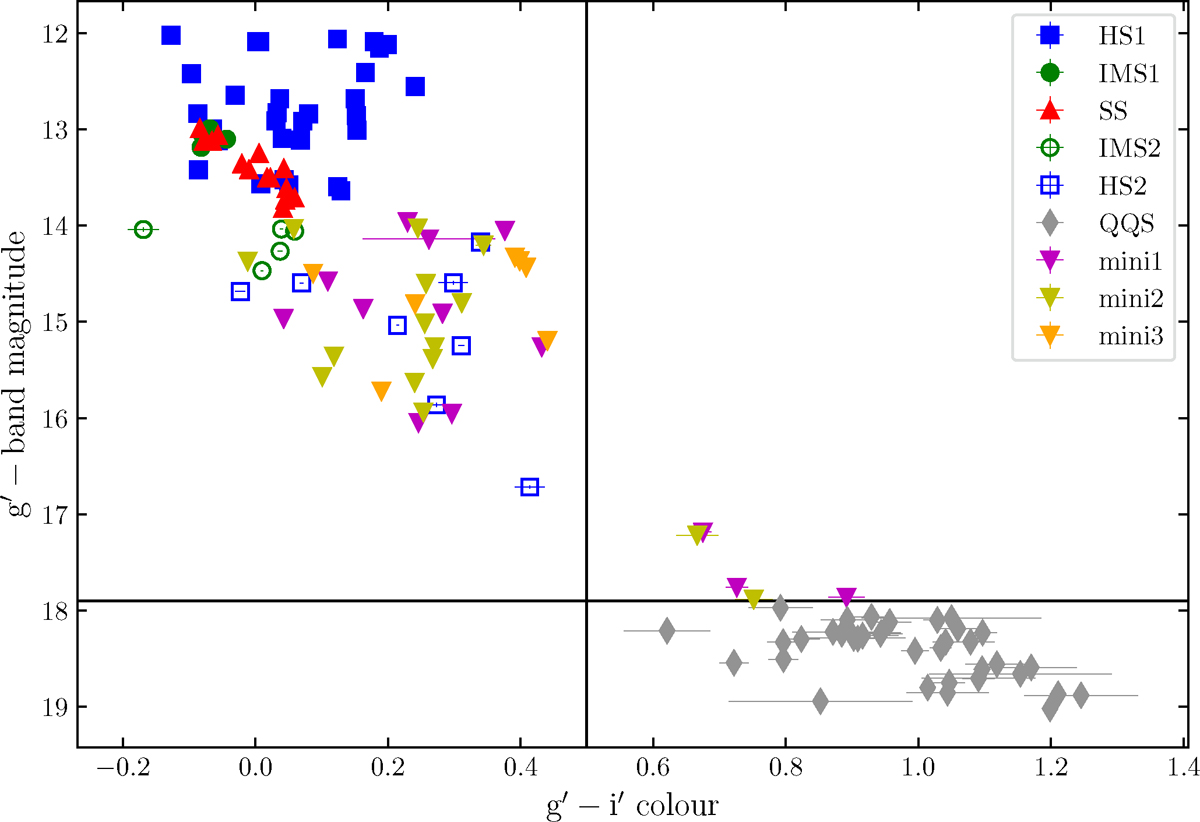
Fig. 2.
Download original image
Colour-magnitude diagram of MAXI J1820+070 showing the correlation between the g′-band magnitude and the g′−i′ colour. The horizontal line represents the threshold of quasi-quiescence (i.e. fainter than 17.9). The vertical line indicates the division of optical colour between the QQS period and the periods of the main outburst and three mini-outbursts. Data points in this figure are colour-coded according to the states defined in Fig. 1.
Current usage metrics show cumulative count of Article Views (full-text article views including HTML views, PDF and ePub downloads, according to the available data) and Abstracts Views on Vision4Press platform.
Data correspond to usage on the plateform after 2015. The current usage metrics is available 48-96 hours after online publication and is updated daily on week days.
Initial download of the metrics may take a while.