Fig. 3.
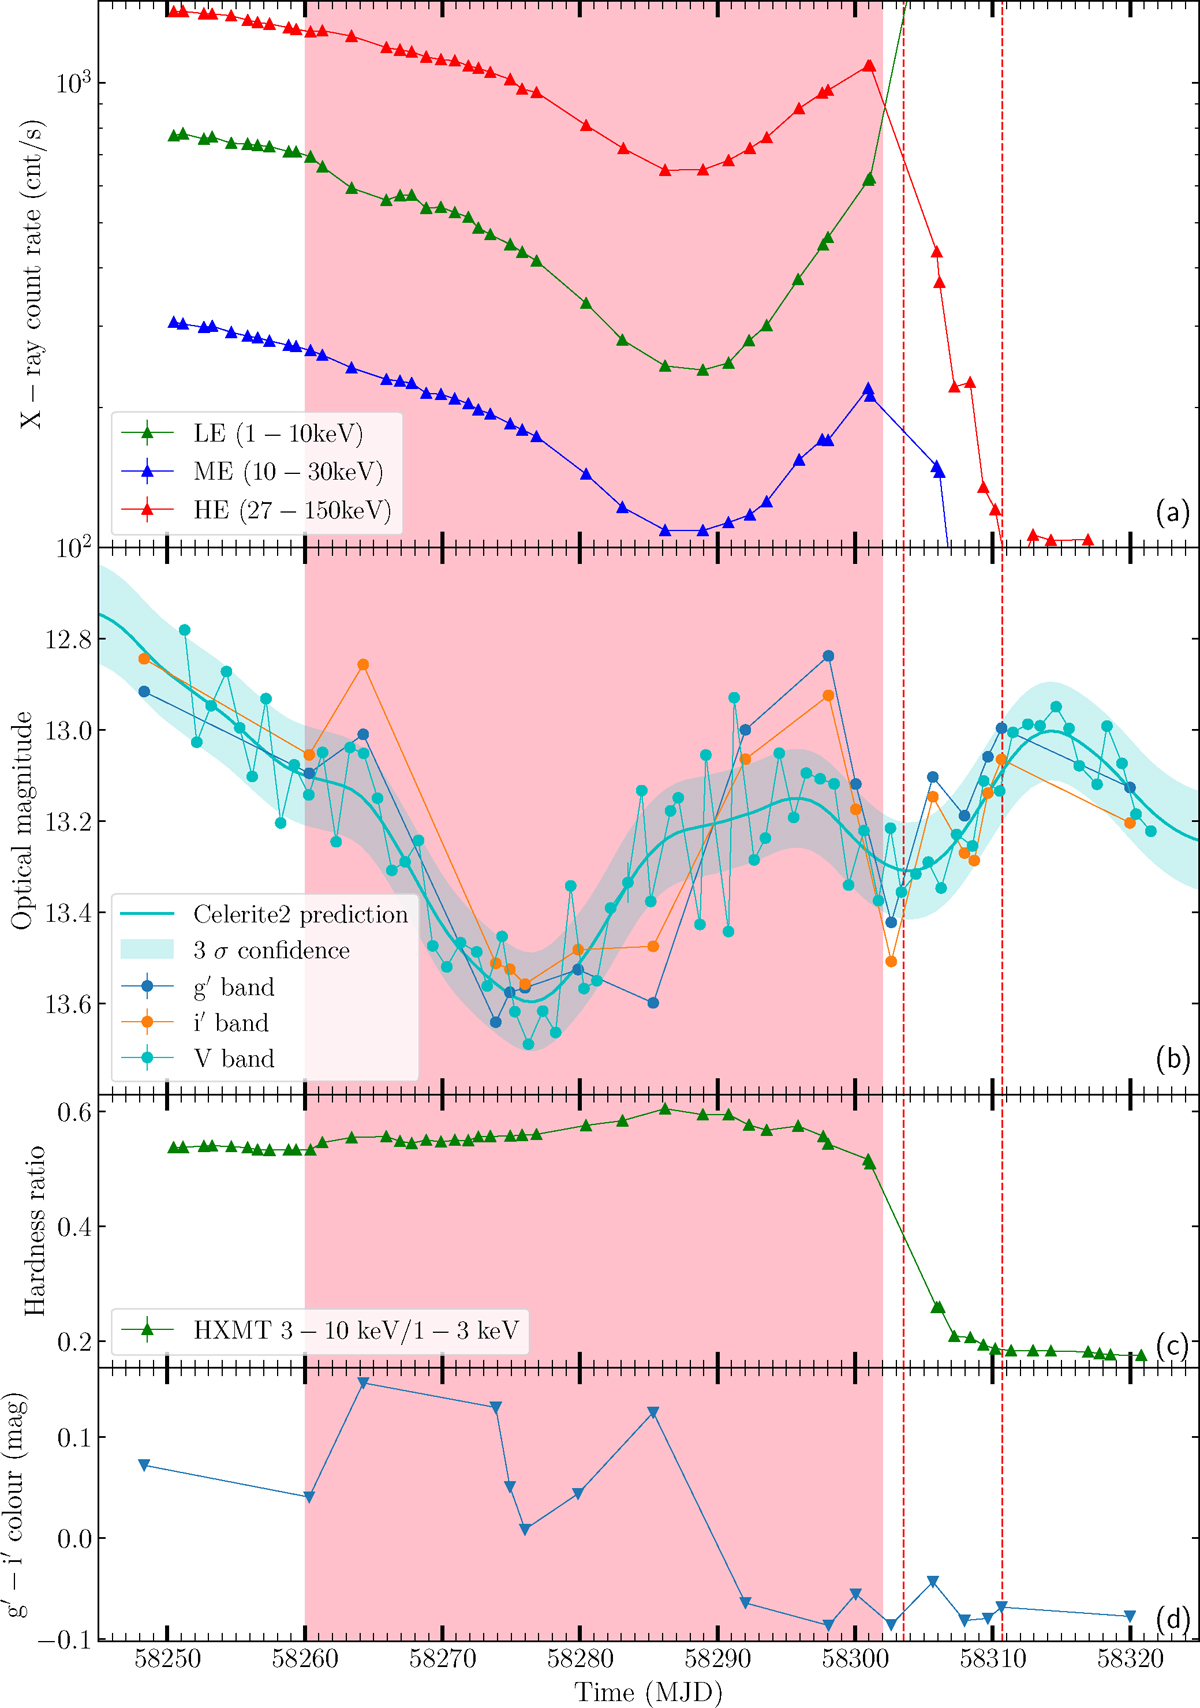
Download original image
Optical/X-ray light curves, hardness ratio, and optical colour evolution during the dip events. (a) X-ray light curves from Insight-HXMT; (b) g′, i′, V-band light curves and 3σ confidence curve of Celerite2 for the V-band light curve; (c) HXMT hardness; (d) g′−i′ colour. The pink area represents the epoch of optical and X-ray dips. The interval between the two vertical dashed red lines marks the first IMS period.
Current usage metrics show cumulative count of Article Views (full-text article views including HTML views, PDF and ePub downloads, according to the available data) and Abstracts Views on Vision4Press platform.
Data correspond to usage on the plateform after 2015. The current usage metrics is available 48-96 hours after online publication and is updated daily on week days.
Initial download of the metrics may take a while.