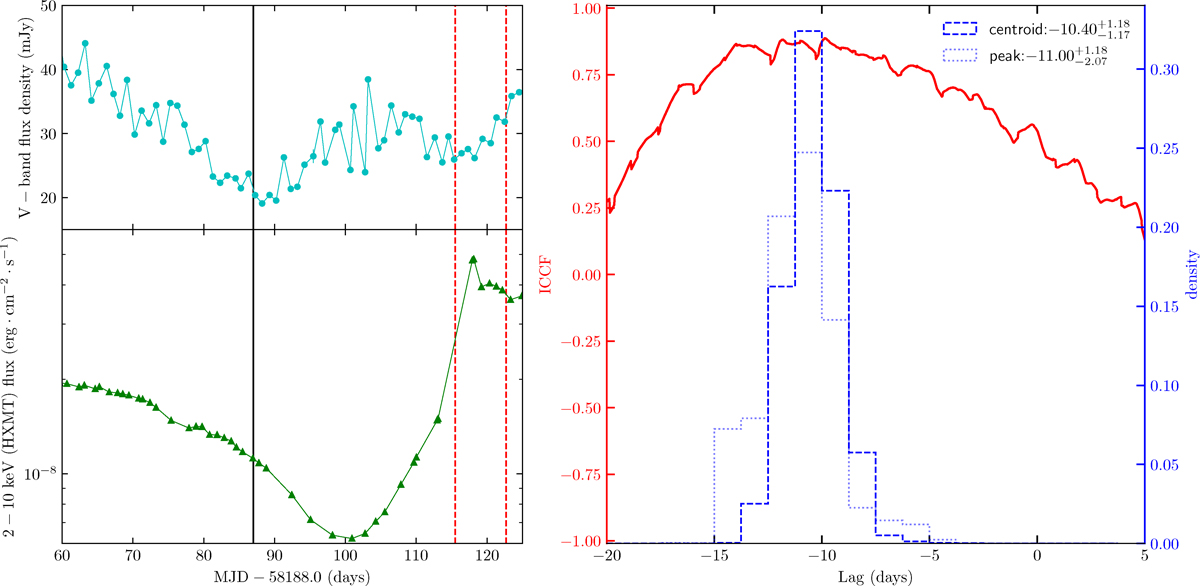
Fig. 4.
Download original image
Left panel: Dip events in the X-ray and optical light curves of MAXI J1820+070. For convenient reference to the period of the occurrence of optical superhump discussed in Thomas et al. (2022) and the X-ray/optical dips, we adopted the start date as used by them (i.e. day 0 is MJD 58188.0). The vertical solid black line (day 87) marks the onset of large-amplitude optical modulation at the superhump period. The interval between the two vertical dashed red lines is the IMS. Right panel: Cross-correlation analysis between the optical (V band) and 2−10 keV X-ray (Insight-HXMT) light curves. The red line shows the cross-correlation function (left axis). The dashed and dotted blue histograms represent the cross-correlation centroid lag distribution and the peak lag distribution, respectively (right axis).
Current usage metrics show cumulative count of Article Views (full-text article views including HTML views, PDF and ePub downloads, according to the available data) and Abstracts Views on Vision4Press platform.
Data correspond to usage on the plateform after 2015. The current usage metrics is available 48-96 hours after online publication and is updated daily on week days.
Initial download of the metrics may take a while.