Open Access
Fig. 6.
Download original image
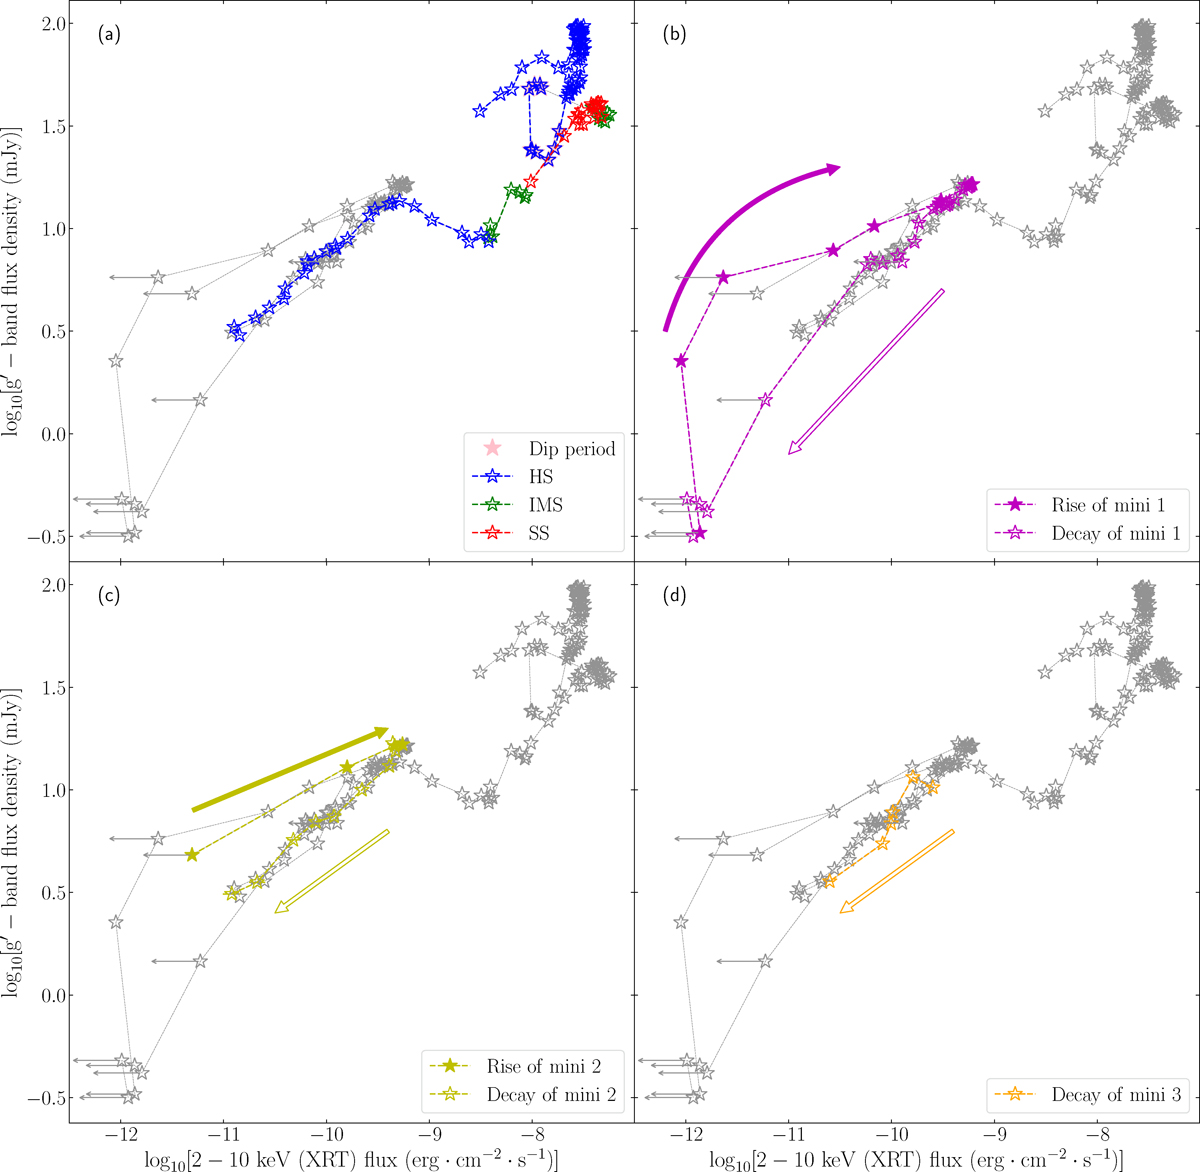
Correlation between the 2−10 keV X-ray flux (Swift/XRT) and the interpolated optical (g′-band) flux density in MAXI J1820+070. The four panels show the main outburst and three mini-outbursts in the correlation diagram. Data points with gray arrows indicate upper limits.
Current usage metrics show cumulative count of Article Views (full-text article views including HTML views, PDF and ePub downloads, according to the available data) and Abstracts Views on Vision4Press platform.
Data correspond to usage on the plateform after 2015. The current usage metrics is available 48-96 hours after online publication and is updated daily on week days.
Initial download of the metrics may take a while.