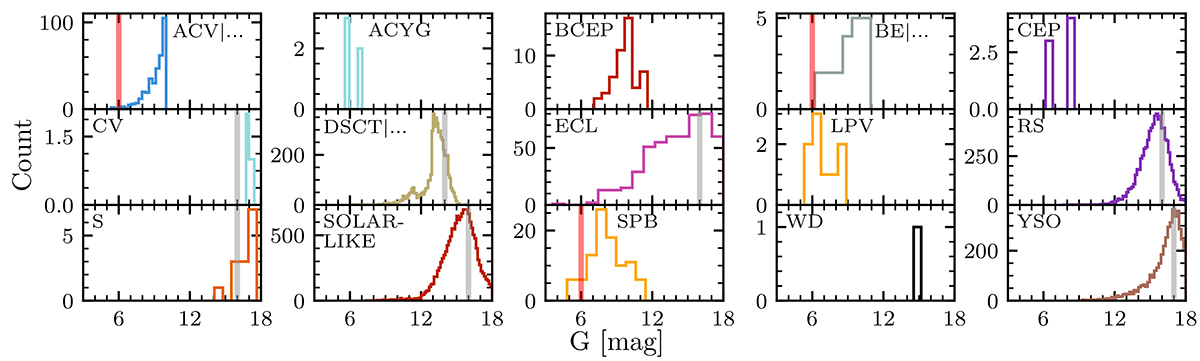
Fig. D.1.
Download original image
Distribution of mG among variable stars in OCs per class. Decreasing counts at fainter mG indicate reduced detectability due to larger photometric errors. Vertical gray bars indicate the limiting magnitudes used to select OC samples for computing ℱ and in Figs. 2 and F.1, cf. Appendix D. Red vertical lines are shown for variable classes where OC samples were limited to avoid saturation effects.
Current usage metrics show cumulative count of Article Views (full-text article views including HTML views, PDF and ePub downloads, according to the available data) and Abstracts Views on Vision4Press platform.
Data correspond to usage on the plateform after 2015. The current usage metrics is available 48-96 hours after online publication and is updated daily on week days.
Initial download of the metrics may take a while.