| Issue |
A&A
Volume 700, August 2025
|
|
|---|---|---|
| Article Number | L13 | |
| Number of page(s) | 9 | |
| Section | Letters to the Editor | |
| DOI | https://doi.org/10.1051/0004-6361/202555111 | |
| Published online | 13 August 2025 | |
Letter to the Editor
A bird’s eye view of stellar evolution through populations of variable stars in Galactic open clusters
1
Institute of Physics, École Polytechnique Fédérale de Lausanne (EPFL), Observatoire de Sauverny, 1290 Versoix, Switzerland
2
Max-Planck-Institut für Astronomie, Königstuhl 17, 69117 Heidelberg, Germany
3
Landessternwarte, Zentrum für Astronomie der Universität Heidelberg, Königstuhl 12, 69117 Heidelberg, Germany
⋆ Corresponding authors: This email address is being protected from spambots. You need JavaScript enabled to view it.
, This email address is being protected from spambots. You need JavaScript enabled to view it.
Received:
10
April
2025
Accepted:
10
July
2025
Abstract
Both star clusters and variable stars are sensitive laboratories of stellar astrophysics and evolution: cluster member stars provide context for interpreting cluster populations, whereas variability reveals the nature of individual stellar systems. The European Space Agency’s Gaia mission has revolutionized the census of star clusters in the Milky Way, while simultaneously providing an unprecedented homogeneous all-sky catalog of variable stars. Here, we leverage the third Gaia data release to obtain an empirical bird’s eye view of stellar evolution based on 34 760 variable stars residing in 1192 Galactic open clusters (OCs) containing 173 294 members (variable member fraction 20.0%). Using precise OC distances, dereddened magnitudes, and consistently determined ages, we a) pinpointed regions of pulsational instability across the color-absolute magnitude diagram (CaMD); b) traced the occurrence rate of variables as a function of age, and c) considered the evolution of rotation periods and photometric activity (gyrochronology). The occurrence of pulsating stars can serve as a model- and reddening-independent age estimator. Our results underline that jointly considering stellar variability and OC membership enables a plethora of further applications, such as age dating or dereddening OCs based on expected CaMD locations of variable stars. Upcoming Gaia data releases and the Vera C. Rubin Observatory will vastly increase the extent to which the details of variable stars in OCs can empirically unravel the astrophysics and evolution of stellar populations.
Key words: methods: data analysis / stars: evolution / stars: variables: general / open clusters and associations: general
Both authors contributed equally.
© The Authors 2025
 Open Access article, published by EDP Sciences, under the terms of the Creative Commons Attribution License (https://creativecommons.org/licenses/by/4.0), which permits unrestricted use, distribution, and reproduction in any medium, provided the original work is properly cited.
This article is published in open access under the Subscribe to Open model. This email address is being protected from spambots. You need JavaScript enabled to view it. to support open access publication.
1. Introduction
Open clusters (OCs) are fundamental laboratories of stellar evolution. They are typically considered as simple stellar populations that trace stellar evolution as a function of age and metallicity, and their color-magnitude diagrams (CMDs) provide context for interpreting the nature of their individual member stars. Although the majority of OCs that form initially are dispersed on timescales of ∼10 Myr (Lada & Lada 2003), the ages of observed OCs span several orders of magnitude, up to a few Gyr (e.g., Cantat-Gaudin & Casamiquela 2024). The Gaia mission (Gaia Collaboration 2016) has revolutionized the Galactic OC census (Gaia Collaboration 2017) with ever-improving completeness and purity (e.g., Cantat-Gaudin & Anders 2020; Hunt & Reffert 2023).
Variability constitutes a powerful laboratory for stellar astrophysics, since it unravels the structure and nature of individual objects (e.g., Aerts et al. 2010) as well as stellar populations. Such information can complement constraints provided by CMDs. Large time-resolved surveys, such as the Optical Gravitational Lensing Experiment (Udalski et al. 2008) and VISTA Variables in the Vía Láctea (Minniti et al. 2010), among others, have revolutionized research on variable star populations. In particular, Gaia data release 3 (GDR3) has provided a homogeneous all-sky census of 9.5 million variable stars (Gaia Collaboration 2023b; Eyer et al. 2023).
Variable stars residing in OCs combine the two complementary types of constraint and have a long history of study, with the first variable star members of OCs (classical Cepheids) already identified 70 years ago (Irwin 1955, cf. also Sawyer Hogg 1959). The WEBDA database collected detailed information on OCs and variable stars residing therein (Zejda et al. 2012, last update: 2013). However, Gaia’s capacity to identify large numbers of bona fide variable stars residing in Galactic OCs (Anderson et al. 2013) has yet to be exploited more generally. This Letter showcases the power of jointly considering these two concepts in the form of populations of variable stars in OCs. The high-quality and homogeneous GDR3 data thus create a bird’s eye view of stellar evolution and illustrate how variable star populations evolve over time.
2. Data and methods
We created a high-quality catalog of bona fide variable star members in high-quality OCs from Hunt & Reffert (2024, hereafter: HR24). We adopted HR24’s OC ages, log t, and distances, d. We limited the sample to d ≤ 2 kpc, astrometric S/N > 5, median CMD quality > 0.5 (following Hunt & Reffert 2023), and total extinction AV < 1.5. Bona fide OC member stars identified in HR24 with G ≤ 18 mag were considered to limit any issues related to larger photometric uncertainties. We estimated the effective temperatures of members stars using PARSEC v1.2s isochrones (Bressan et al. 2012) and dereddened all member stars using extinction relations for GDR3 photometric passbands (Anders et al. 2022) assuming a single AV value per OC and the Schlafly et al. (2016) extinction law. A systematic uncertainty of σAV ≈ 0.1 mag (HR24) applies.
Variable OC member stars were identified in the GDR3 specific object studies (SOS) catalogs of long-period variables (Lebzelter et al. 2023, LPVs), RR Lyrae stars (Clementini et al. 2023), Cepheids (Ripepi et al. 2023), eclipsing binaries (Mowlavi et al. 2023), supervised classification (Rimoldini et al. 2023), and solar-like stars exhibiting rotational modulation (Distefano et al. 2023). We manually added the well-known OC Cepheid U Sgr from the supervised classification. Pulsation periods were supplemented where available from SOS main sequence oscillators (Gaia Collaboration 2023a). We inspected the color-absolute magnitude diagram (CaMD) positions of all variable stars in Sect. 3 and found only five misclassifications (see Appendix A).
3. Results
Our high-confidence catalog contains 34 760 variable stars across 1192 OCs containing 173 294 members. The catalog is made available via the Centre de Données de Strasbourg (CDS), including the dereddened photometry of OC members, cf. Tables B.1 and B.2. Table B.3 lists its contents per variability class. Appendix C shows examples of five particularly well-populated OCs. Generally speaking, variable star detectability depends on photometric amplitudes, 𝒜, and precision, σm, in addition to the sampling, baseline, and more. Detectability thresholds of variables in OCs differ substantially because of large ranges of extinction-corrected absolute G-band magnitudes, MG, 0, and d considered as well as the large diversity of variability types and 𝒜, whose definition depends on the type of variations under study. We considered restricted apparent G-band magnitude, mG, ranges in the figure comparisons to avoid saturation and/or high σm as indicated in Appendix D. Detailed investigations of variable star detectability across our OC sample will become possible with the fourth Gaia data release (GDR4).
3.1. Variables across the CaMD
Figure 1 shows the dereddened CaMD of our catalog with Gaia variability classifications (cf. Eyer et al. 2023). Locations occupied by specific classes are highlighted by contours defined by a kernel density estimation (KDE) algorithm and a 20% density threshold. Additional illustrations are available in Appendix E, including the location of individual variable stars and variable star CaMD tracks in Fig. E.1. Figure 1 illustrates the rich diversity of variability across many phases of stellar evolution, complementing related CaMDs in Gaia Collaboration (2019, their Figs. 3–7) and in Appendix E of Rimoldini et al. (2023). Several pulsating star classes populate the upper main sequence, generally following well-known trends with luminosity (e.g., Kurtz 2022). Beginning at the high-luminosity end, five α Cygni variables occupy a narrow region that seems to have evolved off of the main sequence. Below them, several variability types including β Cephei, slowly pulsating B stars (SPBs), and different Be-type variables cover the entire upper main sequence as multiple overlapping variability regions. This overlap may be partially due to ambiguity in assigning variability types based on light curves alone. Further inspection of these overlapping CaMD regions may serve to understand and mitigate confounding factors of classification. Lower on the main sequence are RS Canum Venaticorum (RS CVn) stars and solar-like variables. Young stellar objects (YSOs) appear noticeably above the main sequence. Fourteen short-timescale variables (timescales tens of minutes to 1 d) are found in 13 OCs, slightly blueward of the main sequence between 2.7 ≤ MG, 0 ≤ 11.1 mag. These stars are redder than most short-timescale variables (cf. Fig. 17 in Roelens et al. 2018). LPVs occupy a large color range among the highest-luminosity giants, and classical Cepheid variables occupy the classical instability strip.
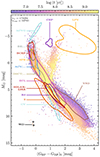 |
Fig. 1. Gaia CaMD of variable OC member stars color-coded by age. Contours show regions occupied by specific variable types (at least three specimens), cf. Sect. 3.1 and Table B.3. Two ZZ Ceti pulsating white dwarfs in the Hyades are shown as black open asterisks. |
3.2. Local variability fractions
Instability strips define specific regions on the Hertzsprung-Russell diagram where stars are unstable to pulsation due to their structure. However, recent studies of δ Scuti stars, classical Cepheids, and RR Lyrae stars have shown differing levels of impurity across the classical instability strip (Murphy et al. 2015; Narloch et al. 2019; Cruz Reyes et al. 2024). This feature cannot currently be explained by stellar theory. In principle, populations of variable stars in OCs are well suited to extend such analyses to other variability types. However, Gaia’s per-epoch photometric errors (2 − 5 mmag in the optimal mG range, cf. Evans et al. 2023; Maíz Apellániz et al. 2023) restrict its ability to detect small-amplitude variations. For example, δ Scuti star amplitudes detected by Kepler are ∼2 mmag and 𝒜 < 10 mmag for the vast majority (Bowman & Kurtz 2018), whereas the lowest 𝒜 = 9 mmag in our sample, cf. Table B.3. Similar limitations apply to, e.g., SX Phoenicis, γ Doradus, and rapidly oscillating chemically peculiar A (roAp) stars (cf. Catelan & Smith 2015). Gaia’s temporal sampling further impacts the detectability. Table B.3 reports ℱvar, the fractions of stars detected as variables within each CaMD contour in Fig. 1, which are not measures of purity as per the aforementioned limitations. Among the extrinsic variables, the highest values of ℱvar are found in the regions occupied by YSOs (32%), solar-like (22%), and RS CVn variables (10%). We find an incidence of 0.30 ± 0.01% eclipsing binaries, which is much lower than reported using the continuously sampled and highly precise Kepler data (Kirk et al. 2016, ∼1.3%), albeit over a larger mass range.
3.3. Variability as a function of age
Figure 2 illustrates the occurrence of variable star types against OC age, normalized by the number of member stars with 4 ≤ MG, 0 ≤ 5 mag. Sample restrictions according to Appendix D are applied to limit the effect of detectability differences. The global variable star fraction as a function of age is shown in Appendix F. In general, younger OCs exhibit the most variable stars (cf. Fig. F.1) and OCs younger than ∼100 Myr exhibit the greatest diversity of variables. Examples of five OCs spanning ages from 5 − 500 Myr are shown in Fig. C.1.
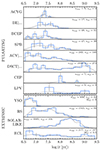 |
Fig. 2. Occurrence of variable stars in classes with at least five members against OC age. Sample restrictions have been applied to ensure consistent detectability limits for each class, cf. Appendix D. For YSOs and ECLs, an additional limit on MG has been applied as labeled. Labels on the left abbreviate GDR3 variability classes, cf. Table B.3. The number of variables is normalized by the number of OC members with 4 ≤ MG ≤ 5 [mag]. Dark gray error bars show Poisson uncertainties, while light gray lines show the KDE-smoothed distribution. |
Figure 2 shows pulsating star classes occupying the upper main sequence increasingly disappear as the main sequence turn-off moves towards lower luminosity (and mass). The cleanest effect is seen for the chemically peculiar and rapidly oscillating A-stars (ACV|...). The DSCT|... group spans the OC age range rather uniformly. Poor statistics limit the ability to trace age dependencies for α Cygni stars, as well as classical Cepheids (for a larger sample cf. Cruz Reyes & Anderson 2023) and LPVs, both of which obey period-age relations (Anderson et al. 2016; Trabucchi & Mowlavi 2022).
Ninety percent of YSOs in our sample reside in OCs younger than 20 Myr. RS CVn stars are found predominantly in young OCs, although they persist to beyond 300 Myr. Above 100 Myr, a sudden decrease among RS CVn is matched by a sudden increase in SOLAR_LIKE types. This echoes the observation in Sect. 3.4 that activity signatures measured by excess photometric scatter dominate at younger ages and is consistent with both variability types being related to solar-like stars and magnetic activity (Berdyugina 2005; Rimoldini et al. 2023).
Eclipsing binaries do not exhibit a significant trend with age, although the KDE-smoothed distribution suggests a slight decrease with log t, which would match the expectation that multiplicity fractions depend on mass (Offner et al. 2023).
3.4. Gyrochonology
Gyrochronology determines stellar ages based on activity indicators related to stellar rotation and/or magnetism (Skumanich 1972; Soderblom 2010; Wright et al. 2011). Our catalog contains 3561 solar-like variables with identified rotation from the GDR3 table vari_rotation_modulation (Distefano et al. 2023) spanning OCs with ages of 6 ≲ t ≲ 800 Myr. As discussed in Rimoldini et al. (2023), these variables overlap with the SOLAR_LIKE and RS CVn in the supervised classification, cf. also Eyer et al. (2023, their Fig. 7). Figure 3 illustrates age trends among these variables using the best rotation periods, Prot, and the maximum of the percentile-based index in G-band, 𝒜G, reported as best_rotation_period and max_activity_index_g. Specifically, Fig. 3 shows the per-OC medians of these quantities for OCs with at least 10 such variables with 0.7 ≤ (GBP − GRP)0 ≤ 1.3 mag, corresponding to the mass range of 0.8 − 1.2 M⊙. Restricting the color interval to 0.9 ≤ (GBP − GRP)0 ≤ 1.1 mag yields a generally consistent picture despite reduced statistics, resulting in a more limited age range of log t ≥ 7.4. Additionally, Fig. 3 shows gyrochronology relations for slowly rotating stars in the middle of our considered color range (assuming (GBP − GRP)0 = 1 mag) from Angus et al. (2015, 2019) and Bouma et al. (2023). Despite Gaia’s individual rotation periods being less precise than Kepler’s (e.g., Santos et al. 2024), the ⟨Prot⟩−log t relation reproduces these trends well. In GDR3, the detection of rotation periods > 5 d is increasingly hampered by Gaia’s scanning law (Distefano et al. 2023, their Fig. 18). In part due to this selection effect, and in part due to few old clusters in our sample, our catalog does not yield a good measure of the Skumanich (1972) law. However, the catalog’s age range is particularly interesting for investigating the earliest ages where gyrochronology relations hold (Boyle & Bouma 2023). Figure G.1 illustrates period-color diagrams versus age and compares them to the I and C sequences of Barnes (2003), suggesting that OCs as young as 25 − 40 Myr may be useful to this end. We expect the doubled baseline and improved photometry in GDR4 to significantly improve the inventory of solar-like rotators in OCs in the near future.
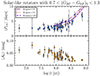 |
Fig. 3. Top: Median rotation period, ⟨Prot⟩, of solar-like rotators in GDR3 against age for 58 OCs, cf. Sect. 3.4. Error bars show the standard error on the median per OC. Literature relations from Angus et al. (2015), Angus et al. (2019), and Bouma et al. (2023) are shown as labeled. Bottom: Same as the top, but for the per-OC median G-band activity index, ⟨𝒜G⟩. |
The activity index, 𝒜G, also exhibits an age trend, albeit of an unclear functional form, cf. Fig. 3. We see that 𝒜G clearly decreases above ∼150 − 200 Myr and exhibits higher levels below, likely due to larger spot size in more magnetically active stars. A hint of saturation may be seen as a leveling off in 𝒜G at ages ≲40 Myr. However, it is not possible to assign a specific age for saturation, partially due to the large scatter in the data.
4. Conclusions and outlook
This Letter showcases the power of variable star populations in OCs to create an empirical bird’s eye view of stellar evolution. Our high-quality catalog of 34 760 variable stars residing in 1 192 OCs is made publicly available. Here, we focused on the relation between the variable star content and ages of OCs. For solar-like rotators, we show that GDR3 activity indicators trace literature relations of gyrochronology well, while providing a useful sample of young clusters near the age where the rotation-activity relation is expected to start. Potential applications of this catalog abound. For example, instability regions may serve as multiple “standard crayons” for dereddening (as done for RR Lyrae stars, e.g., in Nemec et al. 1988), and ages of stellar populations could be determined based on the properties of their variable star types.
Although the spacecraft was recently decommissioned, Gaia’s scientifically most exciting phase is just beginning. GDR4 will provide much improved astrometric OC membership constraints (proper motions to improve by  ) as well as much more abundant and detailed variability information derived from a doubled observational baseline and improved processing. Thus, GDR4’s high-quality homogeneous all-sky census of populations of variable stars in OCs will uniquely advance our understanding of stellar astrophysics and evolution.
Data availability
Full Tables B.1 and B.2 are available at the CDS via https://cdsarc.cds.unistra.fr/viz-bin/cat/J/A+A/700/L13
Acknowledgments
RIA dedicates this work to Gisela L. Anderson. We thank the anonymous referee for constructive reports that improved the manuscript. Useful discussions with L. Eyer are acknowledged. This research received support from the European Research Council (ERC) under the European Union’s Horizon 2020 research and innovation programme (Grant Agreement No. 947660). RIA is funded by the SNSF through a Swiss National Science Foundation Eccellenza Professorial Fellowship (award PCEFP2_194638). This work has made use of data from the European Space Agency (ESA) mission Gaia.
References
- Aerts, C., Christensen-Dalsgaard, J., & Kurtz, D. W. 2010, Asteroseismology (Dordrecht: Springer) [Google Scholar]
- Anders, F., Khalatyan, A., Queiroz, A. B. A., et al. 2022, A&A, 658, A91 [NASA ADS] [CrossRef] [EDP Sciences] [Google Scholar]
- Anderson, R. I., Eyer, L., & Mowlavi, N. 2013, MNRAS, 434, 2238 [Google Scholar]
- Anderson, R. I., Saio, H., Ekström, S., Georgy, C., & Meynet, G. 2016, A&A, 591, A8 [NASA ADS] [CrossRef] [EDP Sciences] [Google Scholar]
- Angus, R., Aigrain, S., Foreman-Mackey, D., & McQuillan, A. 2015, MNRAS, 450, 1787 [Google Scholar]
- Angus, R., Morton, T. D., Foreman-Mackey, D., et al. 2019, AJ, 158, 173 [Google Scholar]
- Barnes, S. A. 2003, ApJ, 586, 464 [Google Scholar]
- Berdyugina, S. V. 2005, Liv. Rev. Sol. Phys., 2, 8 [Google Scholar]
- Bobrick, A., Iorio, G., Belokurov, V., et al. 2024, MNRAS, 527, 12196 [Google Scholar]
- Bouma, L. G., Palumbo, E. K., & Hillenbrand, L. A. 2023, ApJ, 947, L3 [NASA ADS] [CrossRef] [Google Scholar]
- Bowman, D. M., & Kurtz, D. W. 2018, MNRAS, 476, 3169 [NASA ADS] [CrossRef] [Google Scholar]
- Boyle, A. W., & Bouma, L. G. 2023, AJ, 166, 14 [Google Scholar]
- Bressan, A., Marigo, P., Girardi, L., et al. 2012, MNRAS, 427, 127 [NASA ADS] [CrossRef] [Google Scholar]
- Cantat-Gaudin, T., & Anders, F. 2020, A&A, 633, A99 [NASA ADS] [CrossRef] [EDP Sciences] [Google Scholar]
- Cantat-Gaudin, T., & Casamiquela, L. 2024, New Astron. Rev., 99, 101696 [Google Scholar]
- Catelan, M., & Smith, H. A. 2015, Pulsating Stars (Ltd: John Wiley& Sons) [Google Scholar]
- Clementini, G., Ripepi, V., Garofalo, A., et al. 2023, A&A, 674, A18 [NASA ADS] [CrossRef] [EDP Sciences] [Google Scholar]
- Cruz Reyes, M., & Anderson, R. I. 2023, A&A, 672, A85 [NASA ADS] [CrossRef] [EDP Sciences] [Google Scholar]
- Cruz Reyes, M., Anderson, R. I., Johansson, L., Netzel, H., & Medaric, Z. 2024, A&A, 684, A173 [NASA ADS] [CrossRef] [EDP Sciences] [Google Scholar]
- Distefano, E., Lanzafame, A. C., Brugaletta, E., et al. 2023, A&A, 674, A20 [NASA ADS] [CrossRef] [EDP Sciences] [Google Scholar]
- Evans, D. W., Eyer, L., Busso, G., et al. 2023, A&A, 674, A4 [NASA ADS] [CrossRef] [EDP Sciences] [Google Scholar]
- Eyer, L., Audard, M., Holl, B., et al. 2023, A&A, 674, A13 [NASA ADS] [CrossRef] [EDP Sciences] [Google Scholar]
- Gaia Collaboration (Prusti, T., et al.) 2016, A&A, 595, A1 [NASA ADS] [CrossRef] [EDP Sciences] [Google Scholar]
- Gaia Collaboration (van Leeuwen, F., et al.) 2017, A&A, 601, A19 [NASA ADS] [CrossRef] [EDP Sciences] [Google Scholar]
- Gaia Collaboration (Eyer, L., et al.) 2019, A&A, 623, A110 [NASA ADS] [CrossRef] [EDP Sciences] [Google Scholar]
- Gaia Collaboration (De Ridder, J., et al.) 2023a, A&A, 674, A36 [CrossRef] [EDP Sciences] [Google Scholar]
- Gaia Collaboration (Vallenari, A., et al.) 2023b, A&A, 674, A1 [NASA ADS] [CrossRef] [EDP Sciences] [Google Scholar]
- Hunt, E. L., & Reffert, S. 2023, A&A, 673, A114 [NASA ADS] [CrossRef] [EDP Sciences] [Google Scholar]
- Hunt, E. L., & Reffert, S. 2024, A&A, 686, A42 [NASA ADS] [CrossRef] [EDP Sciences] [Google Scholar]
- Irwin, J. B. 1955, MNASS, 14, 38 [Google Scholar]
- Kirk, B., Conroy, K., Prša, A., et al. 2016, AJ, 151, 68 [Google Scholar]
- Kurtz, D. W. 2022, ARA&A, 60, 31 [NASA ADS] [CrossRef] [Google Scholar]
- Lada, C. J., & Lada, E. A. 2003, ARA&A, 41, 57 [Google Scholar]
- Lebzelter, T., Mowlavi, N., Lecoeur-Taibi, I., et al. 2023, A&A, 674, A15 [NASA ADS] [CrossRef] [EDP Sciences] [Google Scholar]
- Maíz Apellániz, J., Holgado, G., Pantaleoni González, M., & Caballero, J. A. 2023, A&A, 677, A137 [NASA ADS] [CrossRef] [EDP Sciences] [Google Scholar]
- Minniti, D., Lucas, P. W., Emerson, J. P., et al. 2010, New Astron., 15, 433 [Google Scholar]
- Mowlavi, N., Holl, B., Lecoeur-Taïbi, I., et al. 2023, A&A, 674, A16 [NASA ADS] [CrossRef] [EDP Sciences] [Google Scholar]
- Murphy, S. J., Bedding, T. R., Niemczura, E., Kurtz, D. W., & Smalley, B. 2015, MNRAS, 447, 3948 [Google Scholar]
- Narloch, W., Pietrzyński, G., Kołaczkowski, Z., et al. 2019, MNRAS, 489, 3285 [NASA ADS] [CrossRef] [Google Scholar]
- Nemec, J. M., Wehlau, A., & Mendes de Oliveira, C. 1988, AJ, 96, 528 [Google Scholar]
- Offner, S. S. R., Moe, M., Kratter, K. M., et al. 2023, ASP, 534, 275 [Google Scholar]
- Riello, M., De Angeli, F., Evans, D. W., et al. 2021, A&A, 649, A3 [NASA ADS] [CrossRef] [EDP Sciences] [Google Scholar]
- Rimoldini, L., Holl, B., Gavras, P., et al. 2023, A&A, 674, A14 [NASA ADS] [CrossRef] [EDP Sciences] [Google Scholar]
- Ripepi, V., Clementini, G., Molinaro, R., et al. 2023, A&A, 674, A17 [NASA ADS] [CrossRef] [EDP Sciences] [Google Scholar]
- Roelens, M., Eyer, L., Mowlavi, N., et al. 2018, A&A, 620, A197 [NASA ADS] [CrossRef] [EDP Sciences] [Google Scholar]
- Santos, Â. R. G., Godoy-Rivera, D., Finley, A. J., et al. 2024, Front. Astron. Space Sci., 11, 1356379 [NASA ADS] [CrossRef] [Google Scholar]
- Sawyer Hogg, H. 1959, JRASC, 53, 97 [Google Scholar]
- Schlafly, E. F., Meisner, A. M., Stutz, A. M., et al. 2016, ApJ, 821, 78 [NASA ADS] [CrossRef] [Google Scholar]
- Skumanich, A. 1972, ApJ, 171, 565 [Google Scholar]
- Soderblom, D. R. 2010, ARA&A, 48, 581 [Google Scholar]
- Trabucchi, M., & Mowlavi, N. 2022, A&A, 658, L1 [NASA ADS] [CrossRef] [EDP Sciences] [Google Scholar]
- Udalski, A., Szymanski, M. K., Soszynski, I., & Poleski, R. 2008, Acta Astron., 58, 69 [NASA ADS] [Google Scholar]
- Wright, N. J., Drake, J. J., Mamajek, E. E., & Henry, G. W. 2011, ApJ, 743, 48 [Google Scholar]
- Zejda, M., Paunzen, E., Baumann, B., Mikulášek, Z., & Liška, J. 2012, A&A, 548, A97 [CrossRef] [EDP Sciences] [Google Scholar]
Appendix A: Removed variable stars
Of the 34 760 variable stars in our initial filtered set, we removed five variable stars for the following reasons. The small number of removed stars speaks to the impressive quality of the variable star classification in GDR3 for stars that are relatively nearby – at least when there are no major complications, such as low S/N data or crowding issues.
Firstly, we removed two stars classified as RR Lyrae variables from our sample (source IDs 5514849058739106048 and 5239771349915805952), both of which reside on the main sequences of very young OCs (10 and 26 Myr). The RR Lyrae SOS (Clementini et al. 2023) mode identification (RRc) suggests rather sinusoidal light curves, which are often difficult to classify. Their location in the CaMD and likely sinusoidal light curves suggest that these stars could be eclipsing binaries, although they are not included in the corresponding SOS table. We therefore do not identify any “young” RR Lyrae stars in of the OCs in our sample, despite the recent claim that such stars could form through binary interaction channels at any age and should be frequent within the Solar neighborhood (Bobrick et al. 2024).
Secondly, we considered including additional LPV candidates from the supervised classification (Rimoldini et al. 2023) in addition to the SOS LPV catalog (Lebzelter et al. 2023). However, we subsequently removed all three candidates based on their under-luminous location in the CaMD. Two of them, GDR3 source IDs 5979495594536212224 and 5979076238279556352, fall near the main sequence and are located in OCs younger than 10 Myr, indicating a possible nature as YSOs.
Appendix B: Data tables
Catalog of OC members with GDR3 variability classifications.
Catalog of OC members with dereddened absolute photometry.
Summary of variable star classes in OCs and their global properties.
Appendix C: Examples of OCs hosting variable stars
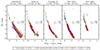 |
Fig. C.1. Five example OCs with variable star members indicated, with OCs increasing in age from left to right. Non-variable member stars are shown by the small gray dots, with variable member stars shown with colored circles according to the legend at the bottom of the figure. The total number of member stars n⋆ and the number that are variable nvar are indicated in each figure. OCs shown were selected to be both well-populated and to span a useful interval in ages. |
Appendix D: On variable star detectability across the catalog
Gaia’s photometric uncertainties set a detectability floor for variability, cf. Sect. 3.2. Additionally, detectability of variables occurring in specific MG, 0 ranges depends on d and AG. Hence, variability detection is hampered both among luminous stars reaching mG ≲ 6 mag and among stars exceeding mG ≳ 13 mag (MG ≳ 1.5 mag at 2 kpc). While we did not determine overall completeness, we sought to ensure consistent (unknown) completeness levels within each variability class across the OC samples used in Figs. 2 and F.1, and when calculating ℱvar. To this end, we did not consider OCs in which the variability contours of Fig. 1 a) for ACV|..., BE|..., and SPBs reached saturation at mG < 6 mag (OC too close), or b) for CV, DSCT|..., ECL, RS, S, solar-like, and YSOs reached an approximate limiting mG determined as a decrease in counts with mG, cf. Fig. D.1. For YSOs and ECLs, we considered smaller ranges in MG, 0 (< 8 mag and < 3.5 mag, respectively), as labeled in Fig. 2 to avoid loss of statistics due to their large MG, 0 contours.
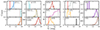 |
Fig. D.1. Distribution of mG among variable stars in OCs per class. Decreasing counts at fainter mG indicate reduced detectability due to larger photometric errors. Vertical gray bars indicate the limiting magnitudes used to select OC samples for computing ℱ and in Figs. 2 and F.1, cf. Appendix D. Red vertical lines are shown for variable classes where OC samples were limited to avoid saturation effects. |
Appendix E: Alternative variable star CaMDs
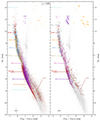 |
Fig. E.1. Left: CaMD with different variability types shown in different colors. Non-variable member stars are shown as small light gray circles. Right: Same as left panel, but showing tracks derived from GDR3 epoch photometry, limited to up to 200 variables per class with the highest number of epochs in GDR3 and the lowest chance of having blended transits (following cuts in Riello et al. 2021, Sect. 9.4). |
Appendix F: Fraction of variables with age
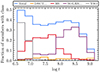 |
Fig. F.1. Fraction of OC members with assigned variability classes in GDR3 against log t, both in total numbers and for the four most populous variable classes individually. Only stars with MG, 0 < 7 mag residing in OCs with extinction-corrected distance modulus μ + AG < 9 are shown so that all member stars have mG < 16. These simple cuts aim to improve the similarity of variability detectability with log t compared to not applying cuts, cf. Sect. D. |
Appendix G: Example Period-color plots
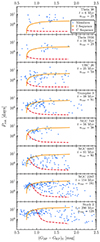 |
Fig. G.1. Period-color diagrams for three OCs that contain solar-like rotators, shown in descending order of age. Blue points show the GDR3 rotation period of these stars from Distefano et al. (2023) against dereddened color. The solid orange and dashed red curves show the predicted location of the I and C sequences of slow and fast rotators from Barnes (2003). The detection of rotation periods > 5 d is increasingly disfavored by the Gaia scanning law (Distefano et al. 2023), which explains the poor match of the I−sequence in NGC 2447. |
All Tables
All Figures
|
Fig. 1. Gaia CaMD of variable OC member stars color-coded by age. Contours show regions occupied by specific variable types (at least three specimens), cf. Sect. 3.1 and Table B.3. Two ZZ Ceti pulsating white dwarfs in the Hyades are shown as black open asterisks. |
| In the text | |
|
Fig. 2. Occurrence of variable stars in classes with at least five members against OC age. Sample restrictions have been applied to ensure consistent detectability limits for each class, cf. Appendix D. For YSOs and ECLs, an additional limit on MG has been applied as labeled. Labels on the left abbreviate GDR3 variability classes, cf. Table B.3. The number of variables is normalized by the number of OC members with 4 ≤ MG ≤ 5 [mag]. Dark gray error bars show Poisson uncertainties, while light gray lines show the KDE-smoothed distribution. |
| In the text | |
|
Fig. 3. Top: Median rotation period, ⟨Prot⟩, of solar-like rotators in GDR3 against age for 58 OCs, cf. Sect. 3.4. Error bars show the standard error on the median per OC. Literature relations from Angus et al. (2015), Angus et al. (2019), and Bouma et al. (2023) are shown as labeled. Bottom: Same as the top, but for the per-OC median G-band activity index, ⟨𝒜G⟩. |
| In the text | |
|
Fig. C.1. Five example OCs with variable star members indicated, with OCs increasing in age from left to right. Non-variable member stars are shown by the small gray dots, with variable member stars shown with colored circles according to the legend at the bottom of the figure. The total number of member stars n⋆ and the number that are variable nvar are indicated in each figure. OCs shown were selected to be both well-populated and to span a useful interval in ages. |
| In the text | |
|
Fig. D.1. Distribution of mG among variable stars in OCs per class. Decreasing counts at fainter mG indicate reduced detectability due to larger photometric errors. Vertical gray bars indicate the limiting magnitudes used to select OC samples for computing ℱ and in Figs. 2 and F.1, cf. Appendix D. Red vertical lines are shown for variable classes where OC samples were limited to avoid saturation effects. |
| In the text | |
|
Fig. E.1. Left: CaMD with different variability types shown in different colors. Non-variable member stars are shown as small light gray circles. Right: Same as left panel, but showing tracks derived from GDR3 epoch photometry, limited to up to 200 variables per class with the highest number of epochs in GDR3 and the lowest chance of having blended transits (following cuts in Riello et al. 2021, Sect. 9.4). |
| In the text | |
|
Fig. F.1. Fraction of OC members with assigned variability classes in GDR3 against log t, both in total numbers and for the four most populous variable classes individually. Only stars with MG, 0 < 7 mag residing in OCs with extinction-corrected distance modulus μ + AG < 9 are shown so that all member stars have mG < 16. These simple cuts aim to improve the similarity of variability detectability with log t compared to not applying cuts, cf. Sect. D. |
| In the text | |
|
Fig. G.1. Period-color diagrams for three OCs that contain solar-like rotators, shown in descending order of age. Blue points show the GDR3 rotation period of these stars from Distefano et al. (2023) against dereddened color. The solid orange and dashed red curves show the predicted location of the I and C sequences of slow and fast rotators from Barnes (2003). The detection of rotation periods > 5 d is increasingly disfavored by the Gaia scanning law (Distefano et al. 2023), which explains the poor match of the I−sequence in NGC 2447. |
| In the text | |
Current usage metrics show cumulative count of Article Views (full-text article views including HTML views, PDF and ePub downloads, according to the available data) and Abstracts Views on Vision4Press platform.
Data correspond to usage on the plateform after 2015. The current usage metrics is available 48-96 hours after online publication and is updated daily on week days.
Initial download of the metrics may take a while.