| Issue |
A&A
Volume 700, August 2025
|
|
|---|---|---|
| Article Number | A164 | |
| Number of page(s) | 12 | |
| Section | Planets, planetary systems, and small bodies | |
| DOI | https://doi.org/10.1051/0004-6361/202555138 | |
| Published online | 14 August 2025 | |
Evolution of ejecta in the (65803) Didymos system driven by the fast-spin primary
Stability conditions, mass transfer, and orbiting disk
1
Instituto de Física Aplicada a las Ciencias y la Tecnología, Universidad de Alicante (UA), Alicante, Spain
2
Observatorio Astronómico, Universidad Nacional de Córdoba, Córdoba, Argentina
3
Consejo Nacional de Investigaciones Científicas y Técnicas (CONICET), Argentina
4
Departamento de Física, Ingeniería de Sistemas y Teoría de la Señal, Universidad de Alicante, Alicante, Spain
5
Dipartimento de Fisica e Astronomia “Galileo Galilei”, Università degli Studi di Padova, Padova, Italy
6
Instituto de Astrofísica de Andalucía – CSIC, Granada, Spain
★ Corresponding author: This email address is being protected from spambots. You need JavaScript enabled to view it.
Received:
11
April
2025
Accepted:
18
June
2025
Abstract
Context. The near-Earth asteroid binary system (65803) Didymos was the target of the DART (NASA) mission, which successfully tested the kinetic impact method to deflect an asteroid in September 2022. The data and images collected during the mission improved the shape model of the two components and the estimates of their physical parameters.
Aims. We improve the model for the material ejection from Didymos due to its fast spin, including the latest DART and LICIACube (ASI) data analyses, in the context of the arrival of the Hera (ESA) mission at the end of 2026.
Methods. We assessed the mass-ejection conditions from the equatorial region and explored the updated mass and volume estimates for Didymos to analyze the dynamics of the ejected particles.
Results. Particle ejection is possible in more than half of the explored parameter space. Most particles (>60%) quickly return to the primary or escape from the system (>6%). A faint disk may form up to the distance of Dimorphos and beyond, but about 10% of the centimeter-sized and larger particles may reach Dimorphos.
Conclusions. The ejection mechanism from the fast-spinning primary is one possible origin of particles that might be detected in orbit during the Hera mission rendezvous. The mass transfer from Didymos may contribute to the explanation of the boulder excess that is observed on the surface of Dimorphos.
Key words: minor planets / asteroids: individual: (65803) Didymos
© The Authors 2025
 Open Access article, published by EDP Sciences, under the terms of the Creative Commons Attribution License (https://creativecommons.org/licenses/by/4.0), which permits unrestricted use, distribution, and reproduction in any medium, provided the original work is properly cited.
This article is published in open access under the Subscribe to Open model. This email address is being protected from spambots. You need JavaScript enabled to view it. to support open access publication.
1 Introduction
The S-type near-Earth binary asteroid (65803) Didymos was the target of the NASA Double Asteroid Redirection Test (DART) space mission, which had on board the Light Italian Cubesat for Imaging of Asteroids (LICIACube) by the Italian Space Agency (ASI). On 26 September 2022, Dimorphos, the secondary body of the binary system, was successfully impacted by DART in the first asteroid-deflection experiment. The mission confirmed the kinetic impact as a valid planetary defense strategy and also improved our knowledge of some of the key physical properties of the binary asteroid system Didymos (Thomas et al. 2023; Daly et al. 2023).
The Didymos Reconnaissance and Asteroid Camera for OpNav (DRACO) camera on board DART took high-resolution images of the two asteroids that revealed that their real shape (Daly et al. 2023; Barnouin et al. 2024) is somewhat different from what was expected based on radar observations (Naidu et al. 2020). The high-resolution images captured by the DRACO instrument also yielded new detailed information on the two surfaces. They allowed us to distinguish complex terrains with different geological units for Didymos and meter to centimeter-size mass distributions of pebbles to boulders on Dimorphos (Barnouin et al. 2024). During and immediately after the DART impact, LICIACube also contributed to capturing further details of the collision together with terrestrial and space telescopes. These included images that showed the morphology of the ejecta plume and allowed us to estimate the size range of the particles in it (Li et al. 2023).
Didymos will be the target of the ESA mission Hera, which will visit the system from December 2026 to July-August 2027, and has the task to fully characterize it (Michel et al. 2022). The MILANI cubesat that will be released by Hera at the system will test its dusty environment by means of the VISTA instrument. This micro-thermogravimeter will be able to detect micrometersize particles. In this way, VISTA measurements will provide constraining information on the dust abundance in the environment of Didymos. The dust in the system will be indicative of electrostatic particle ejection, micrometeorite impacts, and/or primary fast-spin particle liftoff. The combination of the Volatile In-Situ Thermogravimeter Analyzer (VISTA) with other instrument measurements is expected to help us distinguish potential sources of particles in the system itself.
Primaries of near-Earth Asteroid (NEA) binary systems frequently have high rotation rates around their principal inertia axes and a typical top-shape morphology. Didymos was known to be rotating fast (2.2600 ± 0.0001 h, Pravec et al. 2006) at almost its critical stability limit. The DART mission images showed a degraded top-shape (Barnouin et al. 2024), which provided insights into its collisional history (Campo Bagatin et al. 2024). Several authors investigated the process of mass shedding in Didymos (Yu et al. 2019; Ferrari & Tanga 2022; Hirabayashi et al. 2022; Trógolo et al. 2023). Trógolo et al. (2023) showed that particle liftoff from the equatorial region of Didymos through fast-spin rotation is possible for most of the assumed parameter space and leads to the likely presence of orbiting mass in the system. In particular, because the system is quite eccentric (e = 0.38), the amount of material in the environment was analyzed throughout the entire heliocentric orbit. The fine particles (<2 mm) in orbit were found to decrease significantly near perihelion. Similarly, Madeira et al. (2024) explored the possibility that the system surroundings are populated with material, and they highlighted the stable equatorial orbits.
In the framework of the Hera mission, it is important to achieve the best possible prediction of the environmental conditions that the spacecraft will find during its rendezvous in 2027, according to the current estimation of the physical system parameters. Therefore, we refine our previous study (Trógolo et al. 2023) by focusing on newly reported physical parameters and on the shape model of Didymos. On the one hand, we improved the analysys of the dynamics of ejected particles. On the other hand, we determined the conditions required for the survival of mass in orbit at the time of the Hera arrival (early 2027). Unlike in the previous study, we also investigated the transfer of mass to Dimorphos. Sect. 2 focuses on the conditions that need to be met for mass to be lost from the equatorial region. Sect. 3 explains the numerical model in detail and Sect. 4 describes the setup of numerical simulations. Sect. 5 summarizes our results, and the discussion and conclusions are finally presented in Sect. 6.
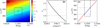 |
Fig. 1 (a) Color map of the stability parameter μ (Eq. (1)) over the 3σ uncertainty range in mass (M) and mean equatorial radius (req). The black box encloses the 1σ uncertainty, and the black dot shows the nominal values (MP, reqP) (see Table 1). (b) Relation between μ and the bulk density ρ. (c) M-req combinations that satisfy μ = 1 (Eq. (1); colored line). The blue segment falls within the 1σ box. The dashed gray lines mark the minimum and maximum req (385 m and 393 m, respectively) that fulfill the condition within 1σ. |
2 Conditions for equatorial stability of Didymos
Didymos is no spherical or axisymmetric body. The shape of the asteroid is therefore crucial for studying the stability conditions. In the asteroid rotating reference frame with angular velocity ω (Didymos spin rate), any particle on the equatorial surface undergoes gravitational (g) and centrifugal (ac) accelerations, which are opposite to each other at the equator. Therefore, we defined the stability parameter μ as the ratio of these accelerations,
 (1)
(1)
where req is the average equatorial radius of Didymos, M is its mass, and G is the gravitational constant. Three dynamical states are possible: μ = 1 corresponds to the threshold for equilibrium on the equatorial surface. For μ > 1, the asteroid rotation is above the stability limit, which may allow for mass lofting. For μ < 1, the asteroid is in a steady state, and mass lofting is not expected on average, but it may take place from elevations for which μ > 1 locally.
The color map in Fig. 1a illustrates changes in the stability parameter (μ) for the potential values of mass and equatorial radius within the reported uncertainty range of 3σ (see Table 1). The central black dot represents the nominal values for the Didy-mos mass, MP = 5.26 × 10¹¹ kg, and reqP = 394 m, the average value of the equatorial radius of Didymos (Naidu et al. 2024). This is different from the radius of a sphere with an equivalent volume, r′P = 356 m. MP was calculated by combining the value of GMsys, where Msys is the total mass of the system, with the available dimensions of the triaxial ellipsoids defined for Didy-mos and Dimorphos (Naidu et al. 2024) (details in Sect. 4). In Fig. 1a, the black box encloses the 1σ uncertainty region, and the dashed white line (μ = 1) separates the stable and unstable regimes. About half (57%) of the color map lies above this line, where centrifugal force exceeds gravity. Within the 1σ region, about 73% falls in the unstable zone. The nominal value (black dot) has μ = 1.04, suggesting a potential unstable state.
After the shape and extent of the asteroid were included in the calculation, we continued to seek changes in the stability parameter as a function of the bulk density of the asteroid (ρ) by replacing M = ρV in Eq. (1), where V = VP (r′/r′P) is the scaled volume. Here, VP is the nominal value of the Didymos volume, rP′ is the radius of the sphere equivalent to the volume VP, and r′ is the radius of the sphere equivalent to the volume V. Table 3 lists the ratio ĉ = req/r′ = 1.11 as constant. This leads to the following expression for an asteroid with an equatorial radius req and equivalent radius r′ of
![Mathematical equation: \mu=\frac{\omega^2 r_{eq}^3}{G \rho V_P\left(\frac{r'}{r_P'}\right)^3}= \frac{3\, \omega^2 \hat{c}^3}{4\pi G \rho} =\frac{14.9}{T ^2 \rho}\ \left[T(\mathrm{h}); \ \rho (\mathrm{g/cm^3})\right].](/articles/aa/full_html/2025/08/aa55138-25/aa55138-25-eq2.png) (2)
(2)
This expression allowed us to trace the relation between the stability parameter and the bulk density of Didymos, as shown in Fig. 1b. Assuming that the mean equatorial radius of Didymos is well determined, we note that stability is achieved for bulk density values higher than 2926 kg/m3, which is higher by ~5% than the nominal value (2790 kg/m3) and barely within the 1σ uncertainty. This again implies that most parameter combinations (~66%) fall inside the unstable regime, including the nominal values. These results are consistent with those by Pérez-Molina & Campo Bagatin (2025), who analyzed the surface stability of Didymos by modeling its shape by superellipsoids.
In Fig. 1c, we explore the possibility that Didymos is in a stable state. We show the combinations of primary mass and equatorial radius that lead to μ = 1 in Eq. (1). The portion of the plot that falls within the 1σ uncertainty box around nominal values is plotted in blue. The stability line (in blue) fully encompasses the possible values for the mass of Didymos, but only covers a range between 385 meters and 393 meters in asteroid equatorial radius (dashed gray lines). This means that if Didy-mos currently is in a stable state, its average equatorial radius is expected to be constrained by these values.
The analysis of the DRACO images revealed features that are consistent with the sliding movement of rocks and mass across its surface (Barnouin et al. 2024). Such an unstable state for the asteroid agrees with what we highlighted in Fig. 1.
While analyzing the variation in the stability parameter as a function of the physical system parameters (mass, equatorial radius, and bulk density) gives a comprehensive perspective on its stability conditions, it is essential to approach the problem through numerical simulations for a full understanding of its inherent dynamical complexity. We wish to study the mass ejection from the surface and followed ejected material to state the implications for the binary system itself.
Physical parameters of the Didymos system.
3 Outline of the numerical model
In Trógolo et al. (2023), we developed a model for investigating the dynamical behavior of particles that can lift from the surface of the Didymos primary due to its rapid rotation. For this purpose, a suitable Fortran77 algorithm was developed (details are provided in Trógolo et al. 2023). As part of the present research, we implemented several improvements to the original model that we detail below.
We refined our model predictions using accurate physical and orbital parameters according to Naidu et al. (2024), along with the latest high-resolution shape model of Didymos, v003 (Daly et al. 2023)1. This updated shape model consists of 3 145 728 facets and 1 572 866 vertices, in contrast to the radar-based Didy-mos shape model we used in our previous work, which contained 1996 facets and 1000 vertices (Naidu et al. 2020).
The computational time of our simulations is highly dependent on the number of facets. An increase in the number of facets by an order of magnitude resulted in an increase in computing time by 14 times. A model with millions of facets cannot be practically handled, and we therefore applied remeshing to smooth out the shape model. Specifically, we used the Meshlab tool called Simplification Quadratic Edge Collapse Decimation to generate simplified versions of the model with 2000, 6716, and 20 000 facets.
Fig. 2 (top) compares the gravitational field as a function of distance from the asteroid for two different paths: one path in the equatorial plane, along the x-axis (x, y = 0, z = 0), and another path along the rotation axis (x = 0, y = 0, z). The results indicate no difference in the gravitational field calculations for shape models ranging from 2000 to ~3 million facets because the three plots overlap. As expected, however, the Didymos gravitational field differs from that of a sphere with an equivalent volume. These models were built using nominal extents, volume, density, and mass following Naidu et al. (2024). Based on this comparison, we selected a 6716-facet shape model with 3594 vertices for the simulations, which provided a balance between computational efficiency and the ability to preserve the topography of the asteroid with enough detail. Fig. 2 (bottom) shows the relative error in the gravitational field generated by the 6716-facet shape model compared to that of a sphere. The gray points represent random (x, y, z) locations for which the error was computed, and the light blue line corresponds to the gravitational field generated by the same shape model in the equatorial plane, specifically, in the (x, 0, 0) direction. The relative error remains below 5% at distances greater than 2300 m to the asteroid center and below 2% in the equatorial plane at the same distance. This analysis clearly shows that it is necessary to have a suitable shape model in the vicinity of the asteroid to consider a good approximation of the gravity field, even though the resolution is not very important. As the distance from the primary grows, the difference in gravity field calculation with respect to a spherical body instead decreases quickly. For this reason, to optimize the computational efficiency, the primary gravitational field was approximated by a sphere for distances beyond 2300 m, where the solutions for the gravitational field of both the sphere and the polyhedron are nearly identical and continue to converge with increasing distance.
The model does not include electrostatic forces or interparticle cohesion. We cannot rule out that these forces may act on asteroid surfaces, but no clear evidence of their presence has been shown so far. In the case of cohesion, both Hayabusa 2 (JAXA) and OSIRIS-REx (NASA) estimated cohesion to be smaller than 1 Pa on the primitive asteroids Ryugu and Bennu, respectively. The Hera (ESA) mission will investigate this further in the case of the stony (S-class) asteroid Didymos.
The DART mission captured and transmitted high-resolution images of the two asteroids shortly before impact. DART approached the Didymos system on a trajectory such that the images obtained by the DRACO instrument essentially photographed just one hemisphere of each asteroid, however, but at different resolutions of the target Dimorphos. This translates into a general mosaic of Didymos made with several images with a resolution of 5 m/pixel on one side and a completely unseen face opposite to the DART trajectory. This limits the fit shape model to one hemisphere. Nevertheless, on a large scale, the shape model shows the apparent regional difference between the equator (smooth region) and the rougher terrain at higher latitudes (e.g., Barnouin et al. 2024; Vincent et al. 2024). We verified that these features are included in the resampled shape model we used here.
In this section, we outline the coordinate systems we used to describe the problem and the forces acting on any particle that was initially located on the surface of Didymos. Then, we define the possible end-states reached by the particle after it evolves in time in the binary system environment, along with the criteria we used to classify these states. We also present the particle size distribution and describe the integration-time procedure.
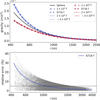 |
Fig. 2 Top: gravitational field of the Didymos shape models (for the mass and volume nominal values) with 2000, 6716, 20 000, and 3 145 728 facets vs. distance in two directions: equatorial x-axis, (x, 0, 0) (blueish lines), and rotation axis, (0, 0, z) (magenta lines). The gravitational field of the equivalent volume sphere is shown as a solid black line. Bottom: relative error of the gravitational field generated by the 6716-facet model vs. the spherical approximation as a function of distance (r). The gray points correspond to random (x, y, z) positions, and the blue line represents the relative error along the x-axis. For distances >2300 m, the relative error on gravity stays below 5% (dashed black line). |
3.1 Detachment condition and choice of the reference system
We handled the conditions under which particles detach from the surface as follows. Initially, we place test particles at rest at the geometric center of each triangular facet of the shape model. Each particle undergoes (F1), the gravitational field generated by the smoothed polyhedral shape model of Didymos (calculated following Werner 1994); (F2), the gravitational perturbation from the satellite of Didymos, Dimorphos; (F3), the Sun’s gravitational pull; (F4), the influence of the solar radiation pressure (SRP); and all noninertial forces within the asteroid rotating frame, that is, (F5 ), Coriolis, and (F6), the contribution of the apparent centrifugal force in the noninertial rotating frame of the asteroid.
At each integration time step (see Section 3.5 for details), a detachment condition is applied to assess whether any given particle had an outward component of local acceleration, which depends in particular on the apparent centrifugal force in the rotating system of the primary. Detachment occurs when  , where Fi (i = 1, . . . , 6) stands for each of the forces mentioned before, and n is the unit vector normal to the surface facet and directed outward. This means that the resulting force has an outward component normal to the considered facet. When this condition is met, the detachment criterion is satisfied, the particle can lift off the surface of Didymos at zero velocity, and it will evolve under the Fi forces. When this occurs, we track its trajectory over time, ruled by the following equation (Trógolo et al. 2023):
![Mathematical equation: \begin{aligned} \frac{d^2 \mathbf{r_d}}{dt^2} =& - \nabla \mathbf{U_P} %W_1 \frac{\mathbf{r_d}}{{r_d}^3} + W_2\frac{\mathbf{r_d}-\mathbf{r_{P \odot}}}{||\mathbf{r_d}-\mathbf{r_{P \odot}}||^3} + W_3 \left[ \frac{\mathbf{r_{P \odot}}-\mathbf{r_d}}{||\mathbf{r_{P \odot}}-\mathbf{r_d}||^3} - \frac{\mathbf{r_{P \odot}}}{r_{P \odot} ^3} \right] \\ & +W_4 \left[ \frac{\mathbf{r_{dS}}}{r^3_{dS}}-\frac{\mathbf{r_{PS}}}{r^3_{PS}} \right] + \boldsymbol{\omega} \times (\mathbf{r_d} \times \boldsymbol{\omega}) + 2 \mathbf{v_d} \times \boldsymbol{\omega.}\end{aligned}](/articles/aa/full_html/2025/08/aa55138-25/aa55138-25-eq4.png) (3)
(3)
This equation describes the motion of a particle in a Cartesian coordinate system (x, y, z), centered at the Didymos center and rotating with an angular velocity ω = 2π/T about its own axis, where T = 2.26 h is the asteroid spin period. In this system, rd is the vector from the primary (Didymos) to the particle, rP⊙ is the vector from the primary to the Sun, rdS is the vector from the particle to the secondary, and rPS is the vector from the primary to the secondary, as shown in Fig. 3. Additionally, rP = rd + rd⊙, where rd⊙ is the vector from any particle that is lofted to the Sun. The first term in Eq. (3) is the gravitational field per unit mass of the polyhedral shape of the primary, as defined by Werner (1994). The second term is the contribution of the solar radiation pressure (SRP), where W2 = (Qpr/c)(E⊙/4π)(πd2/4md). In this expression, Qpr is the efficiency of the solar radiation pressure (equal to one for large absorbing particles, according to Burns et al. 1979), c is the speed of light, E⊙ = 3.93 × 1026 W is the total power radiated by the Sun, d is the particle diameter, and md is the particle mass, calculated as md = ρd(π/6)d3, where ρd is the particle density. The following terms account for the solar and secondary gravitational perturbations, defined as W3 = GM⊙ and W4 = GMS, respectively, where G is the gravitational constant, M⊙ is the mass of the Sun, and MS is the mass of the secondary. The centripetal and Coriolis forces were also included as additional terms in the equation of motion. The Euler force was neglected in this model because changes in the asteroid spin occur on timescales that are much longer than the timescale of particle motion.
The integration process takes the position of particles at any time with respect to the asteroid and the Sun into account. In this way, SRP is turned off when any particle is in the shadow cast by the primary. To model the shadow cone projected by Didy-mos, we adopted for simplicity a spherical profile with radius rF instead of the full shape model. Here, rF is defined as the maximum extent of the shape model, and varies depending on the specific model we used. The shadow that Dimorphos might cast on particles is not considered because it accounts for less than 5% of the surface area of Didymos. This value is lower than other sources of uncertainty in the model.
The convention for the coordinate center and the main axes x, y, z, follows the coordinate system included in the original shape model v003. In this system, the xy plane coincides with the equator of Didymos, and the z-axis points toward the north pole (N) (the direction from which the asteroid is seen to rotate in a direct sense). Furthermore, we defined geographical coordinates on the surface. The intersection of the positive x-axis with the shape model coincides with longitude ϕ = 0°, and the positive direction of the y-axis crosses the asteroid surface at ϕ = 90° in a counterclockwise direction. The latitude (θ) was defined following the standard convention (positive toward north). Moreover, we defined the position vector of the particle as rd and its velocity as vd. In our numerical experiments, the positions of Dimorphos and the Sun were determined by assuming uniform circular motion with periods of 11.9214 h (binary orbit) and 2.11 yr (heliocentric orbit) and initial positions at Tstart. For the sake of completeness and to be consistent with the goal of this work, comparison simulations were performed for the postimpact binary orbit period (11.372 h) (Thomas et al. 2023).
As mentioned above, to save CPU time, the gravity field of the primary was approximated by its corresponding spherical field beyond a distance r > 2300 m, where the difference between the spherical and polyhedral solutions is smaller than 5%.
To analyze the position of the particles that land on the secondary, it is convenient to define a Dimorphos-based noninertial coordinate system (Fig. 3). Although we considered Dimor-phos as a point-mass source for gravitational considerations, we treated it as spherical for the purpose of classifying the particle trajectory (see details in Section 3.2), with a radius RS = 75 m (from the volume-equal diameter of Dimorphos).
Assuming that Dimorphos is tidally locked, the direction from the center of mass of Didymos to the (assumed) spherical Dimorphos always intersects its surface at the same point. In the Dimorphos-based coordinate system, this intersection point has the coordinates (-75, 0, 0) m. We defined the x′ -axis along this line, with the positive direction pointing out of the system (i.e., away from Didymos; see Fig. 3). The y′-axis is oriented in the direction of the Dimorphos motion along its orbit, while the z′ -axis direction is parallel to the Didymos z-axis (pointing toward the north pole of the system, N). We adopted the mutual orbit pole of (λ, β) = (310°, -84°), which means that the secondary follows a retrograde orbit with respect to the primary when viewed from the north pole of the ecliptic. The longitudes on the (spherical) surface of Dimorphos were measured from the x′-axis in the direct sense. Consequently, the y′-axis corresponds to a longitude of 90°, and the x′y′ plane aligns with the orbital equatorial plane of Dimorphos. In order to transform the coordinates from one system to the other, we considered the relative orbital velocity of Dimorphos as seen from the rotating system centered on Didymos. We named the position vector of a particle and its velocity in the Dimorphos-based system r′d and v′d.
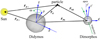 |
Fig. 3 Representation of the coordinate systems. |
3.2 Classification of the end states
When a given particle satisfies the liftoff condition, the two coordinate systems specified in Sect. 3.1 are used to describe and classify its trajectory and final position. Based on the particle position at a given time (e.g., at the end of the simulation), we identified four possible end states (ES) as listed below.
ES1: landed particles. Particles that lifted off and later reimpacted the surface of Didymos. Let rd be the distance from the center of Didymos to a given particle in the Didymos-based reference frame. Similarly, let RP be the distance from the center of Didymos to its surface along the same direction as rd. Since Didymos is an irregular body, RP varies at different points on its surface. At each time step, we confirme whether a particle is located outside (rd > RP) or inside (rd ≤ RP) the surface delimited by the shape model of Didy-mos. When the particle is inside the body, our algorithm identifies the point at which the trajectory of the particle intersects its surface using linear interpolation. We recorded the coordinates of the intersection (latitude and longitude) and the corresponding impact velocity, and we classified the particle as ES1.
ES2: orbiting particles. These particles are in space outside the two bodies at the end of the integration time. In this case, we compute their position and the mass density profile in orbit up to 3 × 10⁴ m from the center of Didymos (see Sect. 3.4 for details).
ES3: particles accreted onto Dimorphos. During the numerical integration, we continuously monitor the position of each individual particle with respect to Dimorphos. Even when we treated Dimorphos as a point-mass source for gravitational considerations, we considered it as a spherical body to determine intersections with particle trajectories. Therefore, when the distance between the position of a given particle and the center of Dimorphos is smaller than its equivalent radius (RS = 75 m, i.e., ||rd - rPS|| < RS), we classify this as a collision on the surface of Dimorphos, and the particle is classify as ES3. First, we calculate the intersection point between the trajectory of the particle and the spherical Dimorphos using a linear interpolation method. Then, we assign the corresponding (x′,y′,z′) coordinates in the Dimorphos-centered reference system to this point, as well as its geographical collision coordinates (θ, ϕ) and the impact velocity vector relative to the surface of Dimorphos.
ES4: escaping particles. These are particles that are located beyond the Hill radius of the system, RHill = 75 km. When particles reach this point, we stop the computation of the trajectory, and they are consider lost from the system. They therefore do not contribute to any mass density calculation.
3.3 Sample particles
At the beginning of each simulation, a set of representative particles are set at rest on each asteroid surface facet to test whether the particles can leave the facet. Particle sizes are chosen to comprehensively investigate the behavior in a wide size range from micron-sized particles that are highly susceptible to the SRP to centimeter-scale particles that are typical of dust ejected from active asteroids (Moreno et al. 2019; Jewitt & Hsieh 2022) up to multicentimeter sizes that are predominantly influenced by gravity. In particular, we selected particles with four different sizes (radius): r1 = 4.7 μm, r2 = 0.1 mm, r3 = 2.3 mm, and r4 = 5.3 cm. We considered these particles as representative of a differential power-law size frequency distribution (SFD), given by n(r) dn ∝ rkdr, with an exponent κ = -3.5 (within the range found for S-type asteroids by Pajola et al. 2024). The particle density was assumed to be 3500 kg/m3, according to the expected composition of the spectral S-type of Didymos, which was found to have L and LL meteorite analogs (Dunn et al. 2013). We stress that assuming the bulk density of asteroids as a density estimation of their smaller components (dust, grains, and even boulders) would be misleading. Small asteroids have a relevant nonzero porosity up to 50%, most of which is due to macroporosity, that is, voids in between the structural components.
3.4 Calculation of the spatial mass density
After we run each simulation and determine the final states of the sample particles, we calculate the total mass in the environment of the system by taking their SFD into account. To do this, we made an arbitrary assumption on the mass emission rate. We considered a constant reference value of the mass production rate for Didymos of dM/dt = 1 kg/s for the whole asteroid. The mass ejected per surface facet in a time interval Δt′ then is
 (4)
(4)
where Stot is the total surface of Didymos, calculated as the sum of the areas of each individual facet (Sfacet). The total mass is distributed according to the mentioned SFD in the radius range [rmin, rmax] = [10-6, 0.25] m. For details about the number of particles emitted from each cell in a given time interval and the corresponding emitted mass, we refer to Section 2.3.2 in Trógolo et al. (2023). To calculate the mass density profile, we first determine the distance to the farthest vertex from the center of the shape model of Didymos, indicated as rF. Then, the radial distance between rF and RHill is divided into 1000 equally spaced bins, which form concentric spherical shells around Didymos. In each cell, the total mass is summed, and the mass density is obtained by dividing this mass by the cell volume.
3.5 Time-integration procedure
In an image of a comet tail, the particles in this tail were ejected from the comet surface at any time t before the time at which the image was taken (Tobs), and therefore, t ≤ Tobs. A similar situation was envisioned for the particles ejected by Didymos. The following procedure was applied to perform the numerical integration. We call Tstart the time at which the program for the first time determines the particle surface detachment condition at any given surface facet. The final Tobs time is instead the time at which the calculation of the particle mass and number density is made (in the analogy above, this corresponds to the time at which the system environment is observed). The total integration time is Tobs - Tstart, which is divided by the number of time intervals nt, so that Δt = (Tobs - Tstart)/nt is the length of each time-integration period (see Table 2). One sample particle of each size is located on every surface facet. At the beginning, the detachment condition for each particle size is determined, and if this is met, the sample particle starts its motion under the action of the corresponding forces, integrated by a fourth-order Runge-Kutta (R-K) integrator with an integration time step h. This is done for all particle sizes. Many different values for the R-K integration time step were tried, and the finally adopted value, h = 60 s, corresponds to the highest value that allows the integration to converge. When the integration was concluded, that is, at t = Tobs, the same procedure is repeated at the initial time Tstart + Δt (Δt >> h), and so on. The same process is carried out for all surface facets. At the end of the whole integration time for all surface facets particles, the data corresponding to the end state of all sample particles are stored along with their position. Table 2 summarizes the simulation parameters we described in this and previous sections.
4 Setup of the numerical experiments
The reference mass for Didymos (MP) was calculated using the following expression:
 (5)
(5)
where we assumed that the primary and the secondary were both triaxial ellipsoids with semiaxes (aP, bP, cP) and (aS, bS, cS), with volumes VP and VS, respectively, the same bulk density and total mass of the system Msys (Table 1). From this, the lower limit for the mass was calculated as M1 = 5.10 × 10¹¹ kg, and the upper limit was calculated as M4 = 5.42 × 10¹¹ kg, while M2 and M3 were equally spaced between M1 and M4 (see Fig. 4).
To calculate the volume, we relied on the sizes of the triaxial ellipsoid with their respective uncertainties (aP ± ea, bP ± eb, cP ± ec) and on the smoothed shape model for Didymos (see Section 3). Initially, the shape model had nominal sizes that corresponded to those published in version v003 (Daly et al. 2023), and we therefore rescaled it to (aP, bP, cP) and obtained the central value of the volume, V3 = 1.88 × 10⁸ m3. This value coincides with VP in Eq. (5). V1 is defined as the lower limit of the volume, obtained by fitting the shape model to sizes (aP - ea, bP - eb, cP - ec), while the upper limit of the volume, V5, is given by fitting the shape model to (aP + ea, bP + eb, cP + ec). V2 and V4 were obtained by taking values equally spaced between V1 and V3, and V3 and V5, respectively. The values are reported in the caption of Fig. 4. The different combinations of (Vi, Mj) with the corresponding bulk densities are listed in Table 3.
To set up numerical simulations, we used three parameter groups: the physical parameters of Didymos (Table 1), and the orbital and simulation parameters (Table 2). The orbital and simulation parameters remained constant in all simulations, as did the size and the mass of the secondary, as well as the distance between the asteroids. The mass, volume, and bulk density of the primary varied in each case.
We performed short- (one month) and long-term (six months) numerical integrations that ended at the same observation time (Tobs). This choice was motivated by the fact that numerical simulations are especially time-consuming, making it essential to optimize the computational time. Short-term simulations enabled us to initially explore the parameter space to assess whether particles can be found in different final states. In contrast, long-term simulations were used to determine whether the system reached a steady state, meaning whether the process of ejection, escape, and particle replenishment stabilized over time. In both cases, the integration time step was set to h = 60 s.
Evolving particle trajectories for the longest time allowed us to derive their average lifetimes, and a statistical analysis of their final states became possible. The tests carried out over a sixmonth time span indicated that the longest lifetime ofr4 particles that remained in orbit was approximately three months. These results are analyzed in Table 4. Therefore, a six-month simulation is sufficient to ensure that steady state has been reached and to fully cover the particle lifetimes.
In the short-term simulations, we evaluated the behavior of particles corresponding to 20 combinations of mass, M, and volume, V, over 31 days: starting on 1st December 2026, ending on 1st January 2027. Fig. 4 presents a general setup of the physical parameters of Didymos: mass, volume, bulk density, and the μ value. From now on, we identify as Sij each combination of Vi and Mj. We also sampled four of the last eight simulations in Table 3 for which we found particles in all four possible end states (as shown in Table 3; see Sect. 5): S31, S41, S52, and S51. We performed a long-term evolution of these cases over six months, from 1st July 2026, to 1st January 2027. We analyzed the particles in detail that collided with the primary (ES1), we studied the median lifetime and distribution of orbiting particles (ES2) as well as particles transferred to Dimorphos (ES3), and we studied their impact velocities. Finally, we also computed the ratio of the escaping particles (ES4).
We chose 1st January 2027 as the observation time as a reference time for the arrival of the Hera spacecraft to the system; Hera will be studying the system and deploy two CubeSats, Milani and Juventas. The first will carry the VISTA dust detector (Gisellu et al. 2023). This instrument will be able to detect dust and volatile particles up to 5 μm, which will provide valuable information on the presence of dust in the environment of the two asteroids.
System simulation parameters.
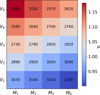 |
Fig. 4 Setup of the 20 simulations. They are denoted in the text as Sij, where the subscript i indicates the Vi value we used for the volume, and the subscript j indicates the Mj value for the mass of the simulated Didymos. The corresponding values are V1 = 1.70 × 10⁸ m3, V2 = 1.78 × 10⁸ m3, V3 = 1.88 × 10⁸ m3, V4 = 1.97 × 10⁸ m3, V5 = 2.07 × 10⁸ m3 and M1 = 5.10 × 10¹¹ kg, M2 = 5.18 × 10¹¹ kg, M3 = 5.34 × 10¹¹ kg, and M4 = 5.42 × 10¹¹ kg. The number in each square is the bulk density in kg/m3, calculated as ρ = M/V. The color-code shows the value of the stability parameter μ. For more details, see Table 3. |
Summary of the 20 short-term simulations.
Percentage of particles in each ES and their median lifetime (tl).
5 Results
5.1 Short-term simulations
Table 3 is a summary of the results of the short-term simulations. The table is sorted in ascending order according to the value of the stability parameter μ, calculated using Eq. (1), listing values of req and Mj at constant ω. The last four columns indicate whether particles end up in some of the four end-states.
We found that in 16 (of 20) combinations of mass and volume, particle ejection from the surface of Didymos may occur, even in cases for which the stability parameter is μ < 1, because the local values >1 correspond to elevations in the equatorial region. When particle lofting occurred, some were swept out of the system, mainly by SRP. In 10 cases, the largest orbiting particles remained in the system up to 26 days. In the 8 cases below the horizontal line in Table 4, mass is transferred to the secondary. The ejection of particles is more likely in these cases than in the rest. The higher the value of μ, the lower the asteroid density (ρ), and the larger the number of ejected particles.
This first look at the behavior of ejected particles is useful to highlight cases that may be relevant to studying the longterm evolution. We now focus on the last simulations in Table 3 because it is interesting to study cases that correspond to possible mass transfer to Dimorphos.
5.2 Long-term simulations
Table 4 shows the percentage of particles that reach each final state, as well as their median lifetimes, corresponding to cases S31, S41, S52, and S51. They cover bulk densities ranging from 2 450 kg/m3 to 2 730 kg/m3, which is essentially the same density range as was found by Makadia et al. (2025). The total amount of ejected mass varies in different simulations. In particular, the higher the asteroid bulk density, the less mass is ejected (Trógolo et al. 2023). Table 4 reveals that neither the percentage of particles in each end state nor their lifetimes change significantly across the range of physical parameters we studied. The final state of any particle is strongly influenced by its size. For instance, small particles are highly sensitive to SRP (as it depends on the inverse square of the radius), while the trajectories of the largest particles we considered are expected to evolve mainly due to gravitational perturbations. In the following subsections, we analyze the different final states of the particles.
We did not include any size-dependent force between particles (e.g., no cohesion) in the model. We therefore do not expect any difference in the conditions for detachment. This means that particles of any size, including boulders larger than the size range we studied, obey the same liftoff conditions. The only exception is SRP, which may help lighter particles in the detachment phase, and will certainly influence their dynamical evolution.
5.2.1 Particles that return to Didymos (ES1)
Particles with r1 = 4.7 μm are most strongly influenced by SRP, and their fate mostly depends on whether they are exposed to sunlight at the time of ejection from the surface of Didymos. If a particle is released from a facet exposed to solar radiation, the gravity of Didymos and the SRP will both act by pulling and pushing, respectively, the particle back to its surface. The results show that more than 88% of r1 ejected particles return to the Didymos surface in approximately 0.06 hours (Table 4).
Fig. 5 shows the landing positions of particles as a function of size for the S51 case. This corresponds to the highest-density case, as a reference. In all scenarios, the smallest particles (r1) land closer to their original position than larger particles. In contrast, the landing positions of particles with a size r2 and r3, influenced by the SRP and the gravitational field of Didymos, are spread across mid-latitudes. These particles also have longer lifetimes in the system that range from 0.1 to 5 hours for r2 and 6 to 11 hours for r3. The behavior of r4 particles is mainly governed by the gravitational influence of Didymos and their encounters with Dimorphos; between 62% and 67% of these particles return to the surface of the primary, and they mostly cover the equatorial region and high latitudes in the northern hemisphere of Didymos. The lifetime of these particles is shorter than 11 h.
Fig. 6 shows the landing positions of particles in simulations S31 and S52. The latter is representative of high-density cases, regardless of the particle size. The left column corresponds to the hemisphere imaged by DRACO, and the right column shows the hidden hemisphere of Didymos. As the bulk density of Didy-mos decreases, the amount of ejected material increases, which leads to an increase in the landing particles. In case S31, particles land in a region that is concentrated around the equator, although it is not uniformly distributed in longitude. The landing positions usually correspond to highs, where particles may encounter the surface while moving on low-altitude orbits. In S52, particles are distributed in a wide band around the equator, with a clear tendency to cover the northern hemisphere because of the irregular asymmetric shape of the asteroid.
Probabilities differ by less than 2% when we switch from pre- to postimpact orbital conditions, and the lifetimes differ by 0.5 h at most. This corresponds to r3 size particles, for which the time before they return to the surface shortens from 2 h (preimpact) to 1.5 h (postimpact).
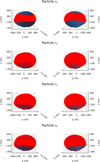 |
Fig. 5 Landing particles (red dots) in simulation S51, displayed by size. The left column shows the hemisphere pictured by DRACO, and the right column displays the farside hemisphere of Didymos. |
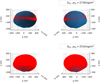 |
Fig. 6 Landing particles of all sizes (red dots) on Didymos, corresponding to simulations S31 and S52 . The left column shows the hemisphere pictured by DRACO, and the right column displays the farside hemisphere of Didymos. |
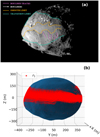 |
Fig. 7 (a) High-resolution DRACO image of Didymos with mapped geomorphological features (adapted from Barnouin et al. 2024). The image shows the position of individual boulders and their corresponding tracks (Bigot et al. 2024), along with the different geological unit limits described by Barnouin et al. (2024). (b) Landing positions ofr1 particles on the Didymos shape model, corresponding to case S41 (red dots). |
5.2.2 Orbiting and escaping particles (ES2 and ES4)
Mass density profiles as a function of radial distance from the center of Didymos are shown in Fig. 8, following the calculation procedure described in Sect. 3.4. As expected, the denser the asteroid, the lower the mass in orbit. The disk-shaped structure reaches its maximum between 600 and 700 m from the center of Didymos. Beyond this distance, the mass density profile generally decreases. However, a slight density increase is observed that corresponds to the Dimorphos orbit: This feature can be interpreted in the frame of dynamical semistable structures in the restricted three-body problem (Murray & Dermott 1999; Madeira et al. 2024). If the timing is right, these particles may collide with the secondary. Beyond 5000 m, the density of the orbiting mass is essentially zero. During December 2026, the Hera spacecraft will start the orbit insertion, which will be completed at the end of January or beginning of February 2027. After this, the spacecraft will enter the Early Characterization Phase (ECP), which involves performing hyperbolic arcs at distances that typically range from 20 to 30 km from the system (Michel et al. 2022). At these distances, the probability of encountering hazardous material in orbit is therefore very low and is not expected to represent a threat to the spacecraft.
Fig. 9 shows structures in the disk that are missed in the profiles. Each row corresponds to a different simulation. The left column shows the edge-on disk view, and the right column shows the view from the north pole.
We see a disk-shaped structure that mostly consists of r4 particles that are distributed radially in the x-y plane around Didymos. In the S52 case, two different structures are visible in the y - z plane: a coplanar disk aligned with the equator, and a second disk slightly inclined with respect to it. This is due to initial ejection conditions and to the inclination of the Didymos system orbit with respect to the ecliptic plane (3.4°). r4 particles are stablest because they are minimally affected by SRP and can remain in orbit for over 23 days (median lifetime); some of them even persist for the entire six-month simulation span (Table 4). A significant percentage (over 19%) eventually escape from the system in any direction as a result of the cumulative perturbations they experience from the nonaxisymmetric potential. r3 size particles are distributed in a more compact disk, mostly concentrated in the direction towards the Sun. Their median lifetime exceeds three days. Together with r2 particles, which have a median lifetime shorter than a day, they form spiral structures. Over time, these structures are deformed by SRP and are dragged away from the Sun, where they become part of the dust tail shown in the image. r2 and r3 particles typically reach the system Hill radius in two to ten days, respectively. Finally, r1 particles have significantly shorter orbital lifetimes because SRP is efficient enough to remove them from the system in approximately 11 hours (see Table 4). As a consequence of these results, if continuous ejection of small particles (r1 and r2) takes place at Didymos, the best place to detect the particles is on the nightside of the asteroid, as is shown in the zoomed-in part of the figure. The described features are common to similar low-density cases.
For orbiting particles, probabilities differ by less than 0.6% between pre- and postimpact orbital conditions, while the lifetimes differ by 18 h at most, corresponding to r4 size particles (-8% relative change). In the case of escaping particles, probabilities differ by less than 2% between pre- and postimpact orbital conditions, while the lifetimes differ by less than 0.4 h, corresponding to r4 size particles (~0.1% relative change).
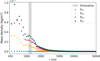 |
Fig. 8 Density profiles of the mass in orbit around Didymos in long-term integrations. The gray area corresponds to the extent of Dimorphos. |
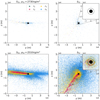 |
Fig. 9 Snapshots of orbiting particles from simulations S31 and S52 after six months. The left column shows the edge-on view, and the right column presents the view from the north pole. The particles are color-coded according to their size. The black dot represents Didymos, and the black circumference indicates the Dimorphos orbit. |
5.2.3 Boulders that reach Dimorphos (ES3)
Our model indicates a significant transfer of material to the secondary body. More than 2% of the r2 particles collide with Dimorphos. This percentage increases for r3 particles and ranges from 6% to 9%, and for r4 particles, for which the collisions range from 7% to 12% (see Table 4). Large particles remain in orbit longer than small particles before they land on Dimorphos, with a median lifetime of up to 13 h. The calculated average collision velocity is 0.14 m/s, which is higher than the escape velocity from the secondary (0.09 m/s).
For the particles that reach Dimorphos, the probabilities differ by less than 0.5% between the pre- and postimpact orbital conditions, and the lifetimes differ by less than 1 h. This corresponds to r4 size particles (-5% relative change).
Figs. 10 and 11 show the position of particles that impact the surface of Dimorphos for each simulation. The left figures show 2D histograms that describe the mass density of particles that land on Dimorphos as a function of latitude and longitude. Above and to the right, the distributions are shown in these coordinates. The trailing hemisphere of Dimorphos is located between ϕ=0° and ϕ=180°, and the leading hemisphere (photographed by DRACO) spans from ϕ=180° to ϕ=360°. The red cross marks the impact position of DART. On the right-hand side of the figure, landing positions of the larger particles (r4) are shown (black dots), the trailing and leading hemispheres are shown in the upper and lower images, respectively. Again, a lower primary bulk density results in larger amount of ejected mass, which means that more material is transferred to the secondary in these cases. The flow of material is mainly concentrated in a region of the Dimorphos surface that is almost entirely located in the trailing hemisphere. It averages approximately ϕ = 151° and θ = 12° . The DART collision point is just outside this region, in a region essentially without reimpacting particles. We identify a peculiar linear landing pattern formed by r4 particles in the side panels. This is mainly associated with families of particles that have similar initial conditions and follow similar trajectories. They land sequentially on the surface of the secondary. In contrast, small particles have more scattered trajectories, which blurs this pattern.
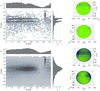 |
Fig. 10 Left: 2D histograms of particles r1, r2, r3, and r4 that reach Dimorphos as a function of latitude and longitude. Right: landing positions of particles r4 (blue dots). We show the trailing (upper image in each row) and leading (lower image) hemispheres. (a) Simulation S31. (b) Simulation S41. |
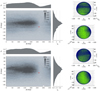 |
Fig. 11 Left: 2D histograms of particles r1, r2, r3, and r4 that reach Dimorphos as a function of latitude and longitude. Right: landing positions of particles r4 (blue dots). We show the trailing (upper image in each row) and leading (lower image) hemispheres. (c) Simulation S52. (d) Simulation S51. |
6 Discussion and conclusions
We first analyzed the physical conditions for mass lofting from the equatorial region of Didymos by defining the stability parameter μ as the ratio of the centrifugal and gravitational forces (Eq. (1)). We evaluated μ over the parameter space of the mass and equatorial average radius of Didymos within their uncertainties, and we found that for more than half of this space (57%) in the color map, the centrifugal acceleration at the asteroid equator exceeds its gravitational force. The nominal values for MP and reqP imply μ = 1.04. In terms of density, we found that Didymos would be stable for densities higher than 2926 kg/m3, which is 5% higher than the nominal value reported by Naidu et al. (2024) (2790 kg/m3), and even higher for the density reported by Makadia et al. (2025) (2600 ± 1400 kg/m3). This result is quite consistent with the findings by Pérez-Molina & Campo Bagatin (2025). Considering nominal semiaxis ratios a/b = 1 and c/a = 0.736 (Naidu et al. 2024), along with the average longitudinal slope angle not exceeding 35° (Barnouin et al. 2024), the authors reported that Didymos can maintain a stable surface (no sliding) for a density higher than 2992 kg/m3. Lower density values, such as those reported by Naidu et al. (2024) and Makadia et al. (2025), would imply higher slope angles to avoid sliding. According to this work, mass sliding and eventually mass lofting may occur unless cohesion forces prevent this.
Second, we updated our previous model of the dynamics of particles ejected from the Didymos surface due to its fast spin (Trógolo et al. 2023). With a smoothed version of the best available asteroid shape model and the physical parameters reported by Naidu et al. (2024), we also reassessed and refined our model. Our results confirm that material ejection is highly sensitive to small changes in mass and volume, supporting the idea that Didymos is near its structural stability limit, according to current knowledge.
We analyzed the dynamics of particles ranging from micrometer to multicentimeter sizes, considering the influence of SRP along with effects of Didymos gravitational field and perturbations from the secondary body. We found that most (60% to 94%) of the lofted particles quickly return to the surface, with median times ranging from a few minutes to 11 hours, depending on the particle size. This behavior might be related to what was shown by the highest-resolution images (5 m/px) from the DRACO camera on board DART. DRACO revealed surface texture and roughness variations that allowed for the identification of different morphological units on Didymos, including mass-wasting features. Barnouin et al. (2024) identified three geological units: smooth lowlands between latitudes ~10°S and ~ 10°N, rougher highlands near the poles, and a transitional zone separating the two units. Linear parallel tracks were found in this unit that were oriented toward the equator, suggesting boulder sliding, even though only a very few boulders were found at the end of these tracks (Bigot et al. 2024). Our results may suggest that particles accumulate in the mentioned smooth lowland areas (Fig. 7a), which might serve as reservoirs for a later mass ejection. The low-speed landing of large particles (r4 = 5.3 cm) at mid-latitudes (high geo-potential) found by our model may trigger avalanches toward the equator (low geopotential) or boulder sliding that forms the observed tracks. When they are at the equator, some of these boulders may again lift off. The Hera mission will be key to gathering physical and geological evidence to support these processes.
Most fine particles below 1 mm that are not pushed back to the primary by SRP are lost from the system in several days at most. This behavior was also observed in the analysis of the dust environment created by the DART impact, where fine particles were carried away by SRP, which disperses them within days or hours (Rossi et al. 2022; Moreno et al. 2022, 2023). In long-term evolution simulations, we found that a disk-shaped structure centered on Didymos may form that even extends beyond the orbit of Dimorphos. The disk density peaks around 260 m above the equatorial surface of the primary and mainly consists of large particles (r4), as a little fraction (<1%) of small particles can be retained in orbit for less than one day, and they form a shallow comet-like tail that is dragged by SRP in the direction opposite to the Sun. The average lifetime in orbit of the largest particles is shorter than one month, although they are constantly replaced by new ones coming from Didymos if the lofting process is somewhat continuous. We did not provide estimates of the absolute mass density in orbit because this strongly depends on the emission rate from Didymos, which is unknown.
We also explored material transfer to Dimorphos. We found that between 7% and 12% of r4 particles reach the secondary. These particles impact the Dimorphos surface at typical speeds of 0.14 m/s, which is higher than the escape velocity of Dimor-phos. The dynamics of r4 particles is scarcely influenced by SRP in the few hours (6-14) of the transfer to the secondary. This means that a similar fraction of lofted boulders (also insensitive to SRP at this timescale) may be able to reach the secondary. The images of Dimorphos obtained by DART and the counting of individual boulders on the surface show an overall dense abundance of boulders (≥ 1 m) in the photographed hemisphere. This shows that Dimorphos is one of the most boulder-rich asteroids visited so far (Pajola et al. 2024). We suggest that migration of boulders to the secondary can contribute to the high boulder abundance on Dimorphos shown in the DART images.
The comparison of the outcome of the dynamical evolution of particles corresponding to pre- and postimpact orbital conditions resulted in negligible differences, as expected.
The distribution of landing particles on Dimorphos is widely spread over the entire surface of the asteroid. However, the mass density histograms show preferential peaks at low latitudes and in the trailing hemisphere. In the case of the largest particles (r4 size particles) we sampled, the landing positions form linear patterns were mainly concentrated around θ = 12° and ϕ = 156° . Furthermore, our results showed that given the current configuration of the binary system, Didymos mass-detachment events may be the cause and result in an accumulation of particles preferentially aligned in the E-W direction on the surface of Dimorphos, as described by Pajola et al. (2024).
Significant differences in the results are found with respect to the previous study (Trógolo et al. 2023). This is due to the update of some key parameter values: For instance, the mass we used in this work is approximately 1% higher than in the former study. The estimated equatorial radius was 417 m (±3%), which was 5% larger than the current estimate. These parameters led to a nominal bulk density of 2170 kg/m3 (±30%), which is lower by 29% than the current nominal estimated value. As a result, the relative mass density of the disk that was formed by orbiting particles in the previous study was higher by an order of magnitude than what we found in the current study. In Trógolo et al. (2023), the particles were distributed in a compact disk that was located in the equatorial region of the primary asteroid, with a peak density at 30-50 m above the mean equatorial surface, with a median lifetime of 4 days. In contrast, our current results show a more diffuse and low-density disk that extends beyond the orbit of the secondary asteroid and peaks approximately 260 m above the mean surface. The lifetimes of the largest particles average 26 days. Furthermore, mass transfer to the secondary asteroid was rare: it was limited to 2% of ejected particles at most. With the updated parameters, the model found that the fraction of particles that is transferred to Dimorphos can be as high as 12%. Fewer than 0.2% of r4 type particles escaped from the system in the previous study, while this percentage now rises to 20%. Although physical parameters such as the mass and size of the asteroid were updated, the most significant change is the new morphology of Didymos, in particular, its shortest to equatorial average axis ratio and overall shape model. This also affects the distance at which the gravitational field derived from the shape models is approximated by a sphere (within a relative error of 3%): from 550 m (previous study) to 3500 m (current study).
In conclusion, a complex dynamical environment governs the evolution of ejected particles in the Didymos system. This complexity was also shown by Madeira et al. (2024). The main drivers of this behavior appear to be, first, the degraded topshape of Didymos; second, the gravitational perturbations by Dimorphos and the Sun; and finally, the variability in SRP caused by the high orbital eccentricity of the system (e = 0.34).
The VISTA instrument on board the MILANI Cubesat (Hera mission) is designed to detect up ~5 micron-size particles in the system. In this context, measurements carried out by VISTA will be crucial to confirm the existence of particles in the system and to help us understand whether any mechanism for a particle ejection from the primary is active. The spatial distribution and density profile that may be derived from these measurements will help us to distinguish the potential dust production processes that is active in the system, namely, electrostatic repulsion, micrometeorite and sesquinary impacts, and mass lofting due to the fast spin of Didymos.
Acknowledgements
NT, ACB, LMP, and PGB acknowledge funding by MCINN project (PGC 2021) PID2021-125883NB-C21 (Spanish Goverment). NT acknowledges funding by CONICET. FM acknowledges financial supports from grant PID2021-123370OB-I00, and from the Severo Ochoa grant CEX2021-001131-S funded by MCIN/AEI/10.13039/501100011033. LMP acknowledges CIAPOS/2022/066 postdoctoral grant (Generalitat Valenciana and European Social Fund).
References
- Barnouin, O., Ballouz, R.-L., Marchi, S., et al. 2024, Nat. Commun., 15, 6202 [Google Scholar]
- Bigot, J., Lombardo, P., Murdoch, N., et al. 2024, Nat. Commun., 15, 6204 [Google Scholar]
- Burns, J. A., Lamy, P. L., & Soter, S. 1979, Icarus, 40, 1 [Google Scholar]
- Campo Bagatin, A., Dell’Oro, A., Parro, L. M., et al. 2024, Nat. Commun., 15, 3714 [Google Scholar]
- Daly, R. T., Ernst, C. M., Barnouin, O. S., et al. 2023, Nature, 616, 443 [CrossRef] [Google Scholar]
- Daly, T., Barnouin, O., Ernst, C., et al. 2023, Derived data products for DART shapemodel: didymos_model_v003, https://pds.nasa.gov/ [Google Scholar]
- Dunn, T. L., Burbine, T. H., Bottke, W. F., & Clark, J. P. 2013, in 44th Annual Lunar and Planetary Science Conference, Lunar and Planetary Science Conference, 1197 [Google Scholar]
- Ferrari, F., & Tanga, P. 2022, Icarus, 378, 114914 [NASA ADS] [CrossRef] [Google Scholar]
- Gisellu, C., Palomba, E., Dirri, F., et al. 2023, in LPI Contributions, 2806, 54th Lunar and Planetary Science Conference, 2732 [Google Scholar]
- Hirabayashi, M., Ferrari, F., Jutzi, M., et al. 2022, Planet. Sci. J., 3, 140 [Google Scholar]
- Jewitt, D., & Hsieh, H. H. 2022, arXiv e-prints [arXiv:2203.01397] [Google Scholar]
- Li, J.-Y., Hirabayashi, M., Farnham, T. L., et al. 2023, Nature, 616, 452 [NASA ADS] [CrossRef] [Google Scholar]
- Madeira, G., Charnoz, S., Rambaux, N., & Robutel, P. 2024, Icarus, 412, 115997 [NASA ADS] [CrossRef] [Google Scholar]
- Makadia, R., Chesley, S. R., Herald, D., et al. 2025, Science, submitted [Google Scholar]
- Michel, P., Küppers, M., Bagatin, A. C., et al. 2022, Planet. Sci. J., 3, 160 [NASA ADS] [CrossRef] [Google Scholar]
- Moreno, F., Jehin, E., Licandro, J., et al. 2019, A&A, 624, L14 [EDP Sciences] [Google Scholar]
- Moreno, F., Campo Bagatin, A., Tancredi, G., Liu, P.-Y., & Dominguez, B. 2022, MNRAS, 515, 2178 [Google Scholar]
- Moreno, F., Bagatin, A. C., Tancredi, G., et al. 2023, Planet. Sci. J., 4, 138 [CrossRef] [Google Scholar]
- Murray, C. D., & Dermott, S. F. 1999, Solar System Dynamics [Google Scholar]
- Naidu, S. P., Benner, L. A. M., Brozovic, M., et al. 2020, Icarus, 348, 113777 [CrossRef] [Google Scholar]
- Naidu, S. P., Chesley, S. R., Moskovitz, N., et al. 2024, Planet. Sci. J., 5, 74 [NASA ADS] [CrossRef] [Google Scholar]
- Pajola, M., Tusberti, F., Lucchetti, A., et al. 2024, Nat. Commun., 15, 6205 [Google Scholar]
- Pravec, P., Scheirich, P., Kušnirák, P., et al. 2006, Icarus, 181, 63 [NASA ADS] [CrossRef] [Google Scholar]
- Pérez-Molina, M., & Campo Bagatin, A. 2025, Celest. Mech. Dyn. Astron., submitted [Google Scholar]
- Rossi, A., Marzari, F., Brucato, J. R., et al. 2022, Planet. Sci. J., 3, 118 [NASA ADS] [CrossRef] [Google Scholar]
- Thomas, C. A., Naidu, S. P., Scheirich, P., et al. 2023, Nature, 616, 448 [NASA ADS] [CrossRef] [Google Scholar]
- Trógolo, N., Campo Bagatin, A., Moreno, F., & Benavidez, P. G. 2023, Icarus, 397, 115521 [Google Scholar]
- Vincent, J.-B., Asphaug, E., Barnouin, O., et al. 2024, Planet. Sci. J., 5, 236 [Google Scholar]
- Werner, R. A. 1994, Celest. Mech. Dyn. Astron., 59, 253 [NASA ADS] [CrossRef] [Google Scholar]
- Yu, Y., Michel, P., Hirabayashi, M., & Richardson, D. C. 2019, MNRAS, 484, 1057 [NASA ADS] [CrossRef] [Google Scholar]
All Tables
All Figures
|
Fig. 1 (a) Color map of the stability parameter μ (Eq. (1)) over the 3σ uncertainty range in mass (M) and mean equatorial radius (req). The black box encloses the 1σ uncertainty, and the black dot shows the nominal values (MP, reqP) (see Table 1). (b) Relation between μ and the bulk density ρ. (c) M-req combinations that satisfy μ = 1 (Eq. (1); colored line). The blue segment falls within the 1σ box. The dashed gray lines mark the minimum and maximum req (385 m and 393 m, respectively) that fulfill the condition within 1σ. |
| In the text | |
|
Fig. 2 Top: gravitational field of the Didymos shape models (for the mass and volume nominal values) with 2000, 6716, 20 000, and 3 145 728 facets vs. distance in two directions: equatorial x-axis, (x, 0, 0) (blueish lines), and rotation axis, (0, 0, z) (magenta lines). The gravitational field of the equivalent volume sphere is shown as a solid black line. Bottom: relative error of the gravitational field generated by the 6716-facet model vs. the spherical approximation as a function of distance (r). The gray points correspond to random (x, y, z) positions, and the blue line represents the relative error along the x-axis. For distances >2300 m, the relative error on gravity stays below 5% (dashed black line). |
| In the text | |
|
Fig. 3 Representation of the coordinate systems. |
| In the text | |
|
Fig. 4 Setup of the 20 simulations. They are denoted in the text as Sij, where the subscript i indicates the Vi value we used for the volume, and the subscript j indicates the Mj value for the mass of the simulated Didymos. The corresponding values are V1 = 1.70 × 10⁸ m3, V2 = 1.78 × 10⁸ m3, V3 = 1.88 × 10⁸ m3, V4 = 1.97 × 10⁸ m3, V5 = 2.07 × 10⁸ m3 and M1 = 5.10 × 10¹¹ kg, M2 = 5.18 × 10¹¹ kg, M3 = 5.34 × 10¹¹ kg, and M4 = 5.42 × 10¹¹ kg. The number in each square is the bulk density in kg/m3, calculated as ρ = M/V. The color-code shows the value of the stability parameter μ. For more details, see Table 3. |
| In the text | |
|
Fig. 5 Landing particles (red dots) in simulation S51, displayed by size. The left column shows the hemisphere pictured by DRACO, and the right column displays the farside hemisphere of Didymos. |
| In the text | |
|
Fig. 6 Landing particles of all sizes (red dots) on Didymos, corresponding to simulations S31 and S52 . The left column shows the hemisphere pictured by DRACO, and the right column displays the farside hemisphere of Didymos. |
| In the text | |
|
Fig. 7 (a) High-resolution DRACO image of Didymos with mapped geomorphological features (adapted from Barnouin et al. 2024). The image shows the position of individual boulders and their corresponding tracks (Bigot et al. 2024), along with the different geological unit limits described by Barnouin et al. (2024). (b) Landing positions ofr1 particles on the Didymos shape model, corresponding to case S41 (red dots). |
| In the text | |
|
Fig. 8 Density profiles of the mass in orbit around Didymos in long-term integrations. The gray area corresponds to the extent of Dimorphos. |
| In the text | |
|
Fig. 9 Snapshots of orbiting particles from simulations S31 and S52 after six months. The left column shows the edge-on view, and the right column presents the view from the north pole. The particles are color-coded according to their size. The black dot represents Didymos, and the black circumference indicates the Dimorphos orbit. |
| In the text | |
|
Fig. 10 Left: 2D histograms of particles r1, r2, r3, and r4 that reach Dimorphos as a function of latitude and longitude. Right: landing positions of particles r4 (blue dots). We show the trailing (upper image in each row) and leading (lower image) hemispheres. (a) Simulation S31. (b) Simulation S41. |
| In the text | |
|
Fig. 11 Left: 2D histograms of particles r1, r2, r3, and r4 that reach Dimorphos as a function of latitude and longitude. Right: landing positions of particles r4 (blue dots). We show the trailing (upper image in each row) and leading (lower image) hemispheres. (c) Simulation S52. (d) Simulation S51. |
| In the text | |
Current usage metrics show cumulative count of Article Views (full-text article views including HTML views, PDF and ePub downloads, according to the available data) and Abstracts Views on Vision4Press platform.
Data correspond to usage on the plateform after 2015. The current usage metrics is available 48-96 hours after online publication and is updated daily on week days.
Initial download of the metrics may take a while.